There are several similar but a little bit different terminology that indicates the ratio between the wanted signal and the unwanted noise. These terms are confusing almost everybody. I will try to explain the concept of these terms as much as practical sense (hopefully). In many case, it would be much easier to understand if you understand on what purpose (in what context) these are used.
All three ratios put the wanted signal in the numerator. They differ in what goes into the denominator. SNR counts only noise. SINAD adds the distortion of the signal itself, which is why audio and ADC work use it. SINR adds interference from other transmitters, which is why cellular networks use it. Keep the denominator in mind, and the three terms stop looking like synonyms.
- SNR - Signal to Noise Ratio
- SINAD - Signal to Noise And Distortion Ratio
- SINR - Signal to Interference plus Noise Ratio
- Reference
SNR - Signal to Noise Ratio
SNR stands for 'Signal to Noise Ratio'. It is pretty much self-explanatory and it would not need much explanation. It is just the ratio of Signal Power and Noise Power as described below in mathematical form.

In dB, the ratio becomes a difference: SNR (dB) = Psignal (dBm) - Pnoise (dBm). For example, a signal at -70 dBm over a noise floor of -90 dBm has an SNR of 20 dB. Both powers must be measured in the same bandwidth, or the difference means nothing.
SNR can be represented in a graphical form as shown below.

SNR can be either positive and negative value if you represent it in dB scale. Negative SNR means that Signal power is lower than the noise power. You may think communication would be impossible in the negative SNR condition, but in reality there is communication system (technology) which is designed to work mostly in such a condition (e.g, CDMA, WCDMA).
Why SNR is important ?
It is because SNR is one of the most important indicator to represent signal quality. You may think Signal Power is the most important factors for signal quality, but in theory Signal power alone does not mean anything in terms of representing signal quality which help you predict how much error will happen for your communication system. Even if your signal power is very strong, you would not get good communication result (low error or no error) if the noise power is high as well. On the contrary, even if the signal power is very low, you would get good communication result if the noise power is much lower than the signal power. This is why in most communication text book or in most of measurement process, SNR rather than the absolute signal power is used as evaluation/test criteria.
Now let's think of how to measure SNR.
You can get the rough estimate of SNR for a certain signal using a spectrum analyzer, but it may not be as easy as it sound to measure the accurate SNR since ideally this measurement should be done at RBW of 1 Hz.
However, if you have to measure SNR in a communication device (not in test equipment), you cannot use the same method as spectrum analyzer. In that case, the device use very complicated signal processing algorithm to estimate SNR and the method itself tend to be different depending on communication technology.
How does SNR impact the performance of a system (especially on the reciever of a transmission system) ? I think following plots would give you an intuitive understanding of this. As you see, as SNR decreases the quality of the signal gets poorer (higher noise level). As a result, Bit Error Rate (BER) will increase and Sensitity will decrease. (Note : Noise added to this example is AWGN. See AWGN page for the details of the relationship between SNR and AWGN)
In the following plots, the red dots indicate the ideal constellation with almost no error and the black dots represents the statistical location of each data points with noises. You can say, the farther a black dot is from the red dots, the higher probable errors (Bit Error) occur. In this example, you see three cases of QAM constellation and each case is exposed to error with different SNR. You would notice that as SNR goes lower the range of constellation spread goes wider. It means.. with the same modulation scheme .. as SNR goes lower, the probablity of error goes higher. If you are not familiar with this kind of concept, please give some more time until you understand the concept.

The same QPSK constellation at 30 dB, 20 dB and 10 dB SNR. Every 10 dB drop spreads the cloud by a factor of about 3.2.
The factor of 3.2 comes from the square root. The noise power grows by 10 for every 10 dB drop, so its amplitude, which is the size of the cloud, grows by the square root of 10. At 10 dB, the clouds already reach close to the decision boundaries on the axes. Some points cross them, and each crossing is a bit error.
Now let's describe on the relationship between SNR and Bit Error Rate in more quantitative way. If you had chance with articles or papers /thesis about communication technology (especially with anything related to transmitter, reciever technology), you would have seen the plots as shown at the bottom right. However, if you are new to this area the interpretation of the plots may not seem to be clear.
Following constellation is based on LTE physical layer specification. The exact quantitative relation between SNR and exact BER would vary depending on each communication system design, but overal logic explained here holds true for any system.
First, take a look at the serieas of constellation at the top track. You see the cases of different modulation (BPSK, QPSK, 16QAM, 64QAM, 256 QAM) but same SNR. You would notice that even with the same SNR you would get higher probability of error as the modulation depth increases. I hope this sounds clear to you. This top track represents a single point on a sequance of graphs in the plot at the bottom as indicated by green arrows. Give some more time to yourself until you clearly understand this.

Now let's decrease SNR by 5 dB. On the top track, you would notice that the range of errors on constellation gets wider and you see the rate of Bit Error increases on the plot.

Now let's decrease SNR by another 5 dB. On the top track, you would notice that the range of errors on constellation gets even more wider and you see the rate of Bit Error increases even more on the plot.

Now let's decrease SNR by another 5 dB. On the top track, you would notice that the range of errors on constellation gets even more wider and you see the rate of Bit Error increases even more on the plot.

From 30 dB down to 15 dB, the error labels on the top track move from No Error toward Almost 100% Error, one modulation at a time.
- The top track shows, from the left, BPSK, QPSK, 16QAM, 64QAM and 256QAM. The blue label above each one gives its error level, from No Error to Almost 100% Error.
- The lower left plot, Modulation vs BER, uses a linear BER axis. The lower right plot, Modulation/SNR vs BER, uses a log axis, so -8 on it means a BER of 10-8.
- The red dashed line marks the SNR of the top track: 30, 25, 20 and 15 dB in the four plots. The green arrows link each constellation to its point on the log curve.
- At 15 dB, the QPSK point sits near -8 on the log axis. The theory for Gray coded QPSK gives Q(√31.6) = 9 x 10⁻⁹ at that SNR, so the curve matches.
The log curves also show the rule of thumb for square QAM. Each step up in modulation, from QPSK to 16QAM to 64QAM to 256QAM, needs about 6 dB more SNR for the same BER. For a BER of 10-3, the standard approximation gives about 9.8 dB, 16.5 dB, 22.5 dB and 28.4 dB. This 6 dB step is why link adaptation moves across a wide SNR range when it changes the modulation.
One detail of the linear plot needs care. At 0 dB, the 16QAM, 64QAM and 256QAM curves start near 0.5, 0.7 and 0.85. A bit error rate cannot go above 0.5, because random guessing already gives 0.5. A simulation with Gray mapping gives about 0.29, 0.36 and 0.40 at 0 dB. So the left end of those curves comes from an approximation that overestimates at low SNR. The trend and the high SNR part of the plots are not affected.
Now would you see any trend from this example ? Even with exactly same constellation, Bit Error Rate increase or decrease based on SNR. Many people tend to think that the error rate is determined by transmitter power and reciever power, but in reality the absolute power is not important. The thing that is really important is SNR. However, in practice many people including me take transmitter or reciever power as an indirect indicator for SNR based on 'BIG ASSUMPTION' that the level of noise is known (even roughly) and the level of noise does not change when you increase or decrease power. If this BIG ASSUMPTION holds true, if you increase Transmitter power you may say SNR would be better than the case when you have low transmitter power. If you have higher recieved power, you may say SNR would be better than the case when you lower reciever power. But don't blindly apply this rule for any accurate analysis or troubleshooting. If you are in stuation where you need very accurate analysis of Bit Error analysis, you need to check SNR of every components on the signal path. I know this is huge job, this is one of the reason why it take such a long time with using a lot of high end test equipment for calibrating the high accuracy test equipment (e.g, Conformance Test system).
As you see above, you might have noticed that SNR is tightly related to BER (Bit Error Rate). You might have seen a kind of general trend as follows :
i) At the same modulation depth, you will get high BER(Poor Performance) at low SNR and low BER (Good Performance) at high SNR
ii) At the same SNR, you will get high BER(Poor Performance) at high modulation depth and low BER (Good Performance) at low modulation depth
However, in modern communication various kinds of channel coding and error correction technology is used to correct the certain degree of BER. So if you measure the error rate after error correction, you may see much lower error rate than the case without error correction. Usually the error rate after the error correction is measured as a parameter called BLER (BLock Error Rate). However, even with this kind of error correction process, you cannot fix all the errors. Therefore, the general trend still holds true at BLER measurement.
i) At the same modulation depth, you will get high BLER(Poor Performance) at low SNR and low BLER (Good Performance) at high SNR
ii) At the same SNR, you will get high BLER(Poor Performance) at high modulation depth and low BLER (Good Performance) at low modulation depth
The exact correlation between SNR and BLER may vary depending on what kind of channel coding and error correction are used. Following graph shows a good example of SNR vs BLER for LTE PDSCH (See Ref [2] for the details. this is data for the system supporting only up to 64 QAM. You would see different plots if you measure with the system supporting 256 QAM).
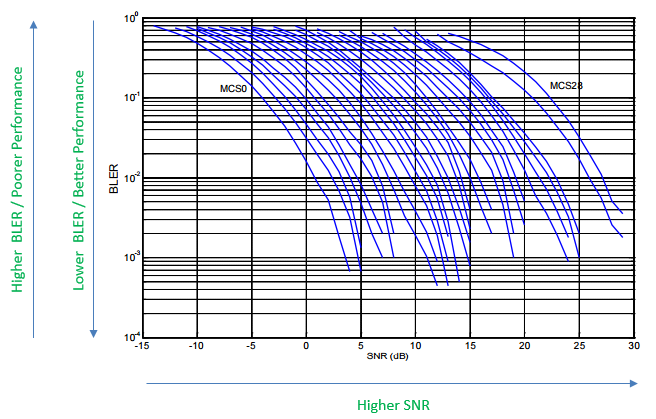
BLER versus SNR for LTE MCS0 to MCS28. Channel coding makes each curve fall steeply, and a higher MCS shifts the curve to the right.
- The horizontal axis is SNR from -15 dB to 30 dB, and the vertical axis is BLER on a log scale. MCS0 is the leftmost curve and MCS28 the rightmost.
- Each curve drops from near 1 to below 10-2 within a few dB. The uncoded BER curves above fall much more slowly.
- At 10 % BLER, the MCS0 and MCS28 curves are more than 25 dB apart. That is the SNR range that LTE link adaptation covers.
SNR, not absolute power, sets the error rate : received power predicts errors only when the noise level is known and fixed.Each QAM step costs about 6 dB : QPSK, 16QAM, 64QAM and 256QAM need about 9.8, 16.5, 22.5 and 28.4 dB for an uncoded BER of 10-3.Channel coding makes the curve steep : BLER goes from high to low within a few dB, so a small SNR change around the threshold matters a lot.Negative SNR can still work : spreading, as in WCDMA, or a low code rate, as in LTE MCS0, lets the receiver decode below 0 dB.
SINAD - Signal to Noise And Distortion Ratio
Similar to SNR, there is another indicator called SINAD. It is defined as shown below. It indicates the ratio of Total energy (Wanted + Unwanted) and Unwanted power. Since the numerator is the total power in the definition, the value in dB is always positive.

- The numerator is labelled Total signal power. It holds the wanted component Psignal and the unwanted components Pnoise and Pdistortion.
- The denominator holds only the unwanted components. So the ratio is always 1 or more, and SINAD in dB is never negative.
In most of RF area, we use SNR more frequently and in some area like Audio signal analysis we tend to use SINAD more frequently.
We often get confused by SNR vs SINAD and have difficulties in understanding the difference between SNR and SINAD. It is well explained in Reference [1] as stated below.
Signal-to-noise ratio (SNR, or sometimes called SNR-without-harmonics) is calculated from the FFT data the same as SINAD, except that the signal harmonics are excluded from the calculation, leaving only the noise terms. In practice, it is only necessary to exclude the first 5 harmonics, since they dominate. The SNR plot will degrade at high input frequencies, but generally not as rapidly as SINAD because of the exclusion of the harmonic terms.
As stated above, the main difference is whether to include 'distortion' in the calculation or not. Distortion can be more intuitively understood in time domain. If you convert the signal with distortion into frequency domain, the distortion appears in the form of harmonics. So in terms of frequency domain, the main difference between SNR and SINAD is whether to include harmonics in the calculation or not.
Two forms of the ratio are in use, so check which one a datasheet means. Radio receiver testing uses the form in the drawing above, with the signal included in the numerator. ADC datasheets, as in Reference [1], put only the signal in the numerator: S / (N + D). The two converge at high values. At 40 dB they differ by less than 0.001 dB. At 10 dB, the receiver form of 10 dB corresponds to 9.5 dB in the ADC form.
Because noise and distortion are both unwanted power, they add as powers, not as dB values. For example, take an ADC with an SNR of 60 dB and harmonic distortion 65 dB below the signal. The unwanted power is 10-6 + 10-6.5 of the signal power, so SINAD = 58.8 dB. The weaker term still costs 1.2 dB. Reference [1] also converts SINAD into ENOB, the effective number of bits: ENOB = (SINAD - 1.76) / 6.02. In this example ENOB is about 9.5 bits.
In the ADC form, SINAD is never higher than SNR : it adds distortion to the denominator, so it equals SNR only when the distortion is negligible.Unwanted powers add linearly : a distortion term 5 dB below the noise still lowers SINAD by about 1.2 dB.Check which definition is used : the receiver form includes the signal in the numerator and the ADC form does not, and the two differ only at low values.
SINR - Signal to Interference plus Noise Ratio
SINR stands for Signal to Interference plus Noise Ratio and the definition can be illustrated as below (I hope this single picture can explain everything). Simply put, SINR is the ratio of the signal (desired signal) and the unwanted noise. The unwanted noise comprises of all the external interference and internaly generated noise.

- Each transmitter on the left sends its own signal S to the receiver across from it. The dashed arrows are interference, labelled In1 and In2, from Tx 1 and Tx 2 into Rx n.
- σ inside each receiver is labelled Noise inherent to Rx 1, meaning the noise generated by the receiver itself.
- The formula divides the wanted signal by In + σn. In is the sum of the interference from all the neighbouring transmitters, with i ≠ n.
- Two labels in the drawing need a correction when you read it. The arrow from Tx 2 is labelled S1 but carries S2. The numerator of SINRn is written Si but means Sn.
SNR and SINR differ only by the interference term, so a numeric case shows when the difference matters. Take a wanted signal at -80 dBm, receiver noise at -95 dBm and interference at -85 dBm. The SNR is 15 dB. The interference plus noise is 10 log10(10-8.5 + 10-9.5) = -84.6 dBm, so the SINR is -80 - (-84.6) = 4.6 dB. The interference dominates, so the cell is interference limited. In that state, a lower noise figure hardly helps, but less interference or a stronger wanted signal does. In a noise limited cell, with little interference, SINR and SNR are almost the same number.
Example 1 : SNR / SINR vs Throughput in a LTE Live Network
Following plot is from the data captured by a drive test tool Azenqos Drive Test tool (AZQ Android). This plot is automatically generated by AZQ Reporting tool and I just did some cosmetic touch on the chart.
This is the real measurement showing the correlation between SINR and Throughput. As you see, as SNR(SINR) goes higher, throughput increases exponentially. In other words, As SNR decreases, the throughput will decrease exponetially. If network does not change code rate (i.e, MCS), the throughput decrease would be due to decoding failure at the reciever (i.e, decoding failure at UE), however in real network UE reports CQI periodically to eNB and eNB changes the code rate accordinly (i.e, decreasing MCS as CQI value gets lower and this results in smaller transport block size), so this throughput change would be due to lower transport block size.

Download throughput against SINR on Rx0. Throughput rises with SINR, and the spread at each SINR is wide.
- The horizontal axis is SINR Rx[0] from -20 dB to 30 dB. The vertical axis is Download Overall Throughput from 0 to 90000 kbps.
- Below about 0 dB, most points stay under 10000 kbps. Above about 20 dB, many points reach 40000 to 80000 kbps.
- At one SINR, the throughput still varies by several times. Scheduling share, rank and the load of the cell also set the throughput, not SINR alone.
The axis is in dB, so the shape needs one more comment. The Shannon limit per Hz is log2(1 + SINR). With SINR in linear units, it gives 3.5 bit/s/Hz at 10 dB, 6.7 at 20 dB and 10.0 at 30 dB. So at high SINR the limit grows by about 3.3 bit/s/Hz for every 10 dB, a straight line on a dB axis. A curve that bends upward on this plot therefore grows faster than the single stream Shannon limit, and more than one factor is changing with SINR.
SINR includes interference, SNR does not : in a loaded cellular network the interference term usually dominates the noise.An interference limited cell gains little from a lower NF : in the example above, removing all receiver noise raises SINR from 4.6 dB to only 5 dB.Link adaptation turns SINR into throughput : the UE reports CQI, and the eNB picks the MCS and so the transport block size.
Reference
[1] Understand SINAD, ENOB, SNR, THD, THD + N, and SFDR so You Don't Get Lost in the Noise Floor by Walt Kester
[2] NISTIR 7986 - LTE Physical Layer Performance Analysis by Wen-Bin Yang, Michael Souryal