This page is not for the explaining on each of these terminologies. If you are not familiar with each of these words, please refer to followings pages first. This page is mainly for practical sense of these terms and even more on inter-relationship among them.
Followings are topics covered in this page.
- Equations Correlating the parameters
- 3GPP Definitions and Reporting Ranges
- Examples
- Example 1 : RSRP/RSRQ/SINR at relatively stationary environment
- Example 2 : RSRP/RSRQ at driving/handover situation
- Example 3 : RSRP/RSRQ/RSSI/SINR at driving/handover situation
- Reference
Equations Correlating the parameters
Now let me summarize several equations (formula) to show the correlations among these parameters. It can be summarized as below. Reading and understanding these equations and take a look at the plot shown below and see if you can understand any further than before you read this section.
The most fundamental (basic) measurement is RSRP. As you see here or described in RSRP page, this is basically a power measurement for a single subcarrier. The value does not change with bandwidth or number of RBs currently assinged for PDSCH. So, this measurement would give you the lowest value comparing to other parameters. RSRP gives you an idea of the strength of the signal it gets from the network, but it is not clear indication of how good the signal quality is.

Next fundamental measurement is RSSI. As you see here or described in RSSI page, it is the total power integrated across the whole bandwidth, so the measured value can change and the number of RBs allocated to PDSCH. The power in RSSI contains not only signal power (desired signal power) but also interference from other cells and any internal/external noise. So high RSSI does not necessarily mean high signal power or good signal quality.

Is there any parameter that can give you an idea of signal quality rather than the signal strength ? This is what RSRQ can give you. Considering RSSI is 'Signal + Noise' or 'Singal + Noise + Interference', you would novice that RSRQ is very similar to the definition of SNR or SINR which are the most common indicators of signal quality. Since 'N x RSRP' is always smaller than RSSI (total received power), the RSRQ is always negative value in dB. The higher RSRQ is, the better the signal quality is if Bandwidth and number of RB allocation is same. However, you cannot get the absolute signal quality information from RSRQ only since the value would vary depending on Bandwidth and RB allocation. As you see in the RSRQ page, the maximum RSRQ value you can achieve is -3dB.

You can get more absolute criteria for signal quality. For this, SNR or SINR would be more accurate. But SNR, SINR was not defined in 3GPP until RS-SINR arrived in Release 13. However, SNR or SINR is very common RF term and the correlation of SINR and RSRQ can be approximated (in dB) as below. SNR, SINR can go negative but in most cases it would be positive value. If you see over 20 dB SNR or SINR, you can say you have have almost ideal signal quality.

The ultimate goal for any communication is to send/receive the data with minimum error and the reason why we all care about the signal quality is to achieve as much data rate as possible. So, you would want to know the correlation between data throughput and the signal quality. That correlation can be expressed as follows. This is from one of the most famous rule in communication theory called Shannon's law.
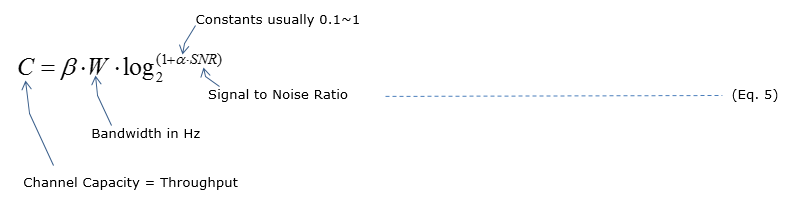
Two of these equations are easier to use in a slightly different form. Eq. 3 is a ratio of linear powers, but drive test tools log everything in dB and dBm. In dB, Eq. 3 becomes RSRQ = 10log10(N) + RSRP - RSSI. So the gap between RSSI and RSRP is 10log10(N) - RSRQ. You can check this gap directly on any plot that carries all three traces, and the examples below do that.
Eq. 4 also hides an assumption. Let's take a fully loaded cell with one antenna port, where every RE carries the same power S. The noise and interference power per RE is I + N. Then RSSI per RB is 12 x (S + I + N), and RSRQ is S / (12 x (S + I + N)). So in linear terms, 12 x RSRQ = SINR / (1 + SINR). Eq. 4 with β = 1 is the low SINR form of this relation, where 1 + SINR is close to 1. Solving it for SINR gives SINR = 12 x RSRQ / (1 - 12 x RSRQ). At RSRQ = -12 dB this gives about 5 dB, while Eq. 4 gives about -1 dB. So use Eq. 4 only as a rough guide, and only when SINR is low.
RSRP is a per RE power : it does not change with bandwidth or with the PDSCH allocation.RSSI is a total power : it grows with bandwidth, with the load in the cell and with interference.RSRQ links the two : in dB, the gap between RSSI and RSRP is 10log10(N) - RSRQ.Eq. 4 is a low SINR approximation : under full load the exact relation is 12 x RSRQ = SINR / (1 + SINR).Throughput follows SINR, not RSRP : Eq. 5 takes SNR and bandwidth, so a strong but noisy signal still gives a low data rate.
3GPP Definitions and Reporting Ranges
The equations above are the practical view. But a UE measures and reports these values under exact 3GPP definitions, and those definitions explain two things you will meet in logs. The first is why RSRQ stops near -3 dB. The second is why a newer UE can report RSRQ above -3 dB, and can report a SINR at all.
36.214 clause 5.1.3 defines RSRQ as N x RSRP / (E-UTRA carrier RSSI). Here N is the number of RBs of the E-UTRA carrier RSSI measurement bandwidth. The UE measures the numerator and the denominator over the same set of resource blocks. So Eq. 3 is the specification formula itself, and it is not an approximation.
The detail that matters is which OFDM symbols RSSI covers. Unless higher layers indicate otherwise, the UE measures RSSI only in the OFDM symbols that contain reference symbols for antenna port 0. In each of those symbols, one RB carries two port 0 CRS REs. Let's take a cell with one antenna port and no noise. With no load, RSSI is 2 x N x RSRP, so RSRQ is 1/2, which is -3 dB. With every RE of those symbols loaded at the CRS power, RSSI is 12 x N x RSRP. RSRQ then falls to 1/12, which is about -10.8 dB. This is where the -3 dB maximum comes from. It is also why RSRQ falls when the cell load rises, even though the signal itself has not changed.
Release 12 added two options to this measurement. If higher layers indicate all OFDM symbols, the UE measures RSSI over all OFDM symbols of the DL part of the measurement subframes. The network can also ask for a wider measurement bandwidth. In 36.331, RSRQ-Type-r12 carries these two choices as allSymbols-r12 and wideBand-r12. With all symbols, the symbols without CRS carry little power in a lightly loaded cell. So RSSI falls, and RSRQ can rise above -3 dB. This is why 36.133 extends the RSRQ reporting range up to 2.5 dB.
Release 13 then defined RS-SINR in 36.214 clause 5.1.23. It is the linear average power of the REs that carry cell-specific reference signals, divided by the linear average noise and interference power over the same REs in the same bandwidth. The UE uses CRS port 0 for it, and it applies in RRC_CONNECTED only. The SINR traces in the examples below come from the drive test tool, so they are not necessarily RS-SINR reports.
All three definitions share one rule for receiver diversity. When the UE uses receiver diversity, the reported value shall not be lower than the value of any individual diversity branch. So a report is never worse than the better antenna. The table below lists the reporting ranges of 36.133 and the 36.331 IEs that carry them.
Quantity |
36.331 IE |
Reporting range in 36.133 |
Resolution |
RSRP |
RSRP-Range, INTEGER 0..97 |
RSRP_00 is below -140 dBm, RSRP_97 is -44 dBm or higher |
1 dB |
RSRP, extended |
RSRP-Range-v1360, INTEGER -17..-1 |
down to below -156 dBm, for a UE supporting CE Mode B |
1 dB |
RSRQ |
RSRQ-Range, INTEGER 0..34 |
RSRQ_00 is below -19.5 dB, RSRQ_34 is -3 dB or higher |
0.5 dB |
RSRQ, extended |
RSRQ-Range-v1250 and RSRQ-Range-r13, INTEGER -30..46 |
-34 dB to 2.5 dB |
0.5 dB |
RS-SINR |
RS-SINR-Range-r13, INTEGER 0..127 |
-23 dB to 40 dB |
0.5 dB |
Keep these ranges in mind when you read a log. A value at the edge of a range is a clipped report, not a measurement. For example, a legacy UE reports RSRQ_34 for every RSRQ of -3 dB or higher. Only a UE that supports the extended range, or RSRQ on all symbols, can report RSRQ-Range-v1250.
Eq. 3 is the 36.214 definition of RSRQ : N x RSRP / RSSI, with both measured over the same N RBs.RSSI covers only the CRS symbols by default : this limits RSRQ to about -3 dB with no load and about -10.8 dB with full load, for one antenna port.Release 12 allows RSRQ on all symbols and on a wider bandwidth : RSRQ can then exceed -3 dB, and the reporting range reaches 2.5 dB.RS-SINR is a 3GPP measurement from Release 13 : it uses CRS port 0 and applies in RRC_CONNECTED.A report at the edge of its range is clipped : it tells you only that the value is at or beyond that edge.
Examples
The three examples below all come from drive test logs, and each one plots several of these quantities against time. So you can hold the equations above against real traces. Example 1 is an almost stationary measurement. Examples 2 and 3 are drives with many handovers, where the serving cell changes every minute or so.
Example 1 : RSRP/RSRQ/SINR at relatively stationary environment
For the motivation on studying the relationships (interplay) of all these different indicator, let's take a look at a measurement done by a UE in the field. Following plot is from the data captured by a drive test tool Azenqos Drive Test tool (AZQ Android). I got the log captured by the tool and exported the data as csv file and then plot it on Microsoft Excel.
The plot below shows five traces on one y axis. Inst RSRP is blue, Inst RSRQ is red, Inst RSSI Rx is grey, SINR Rx[0] is yellow and SINR Rx[1] is green. So the axis is in dBm for RSRP and RSSI, and in dB for RSRQ and SINR.
First, just take a quick look and find which trace (color) indicates which parameters.. do you see any correlations among these traces ?
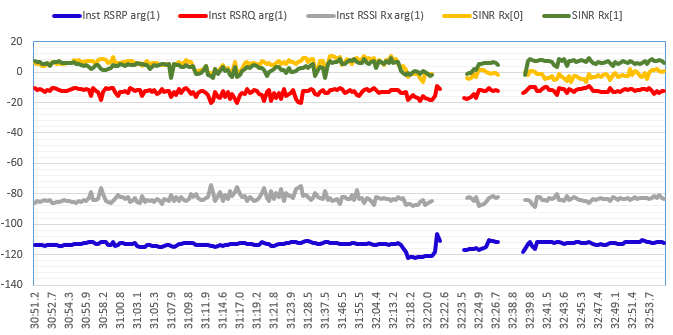
Figure 1. RSRP, RSRQ, RSSI and SINR in an almost stationary measurement. All five traces stop at the same moments, so the UE left the LTE cell rather than losing one measurement.
To me, I notice several different patterns as marked below (you may see different pattern). I cannot explain exactly why I have this kind of multiple different patterns over time (I would need some additional information to explain the reason), but anyway I can see several different patterns.
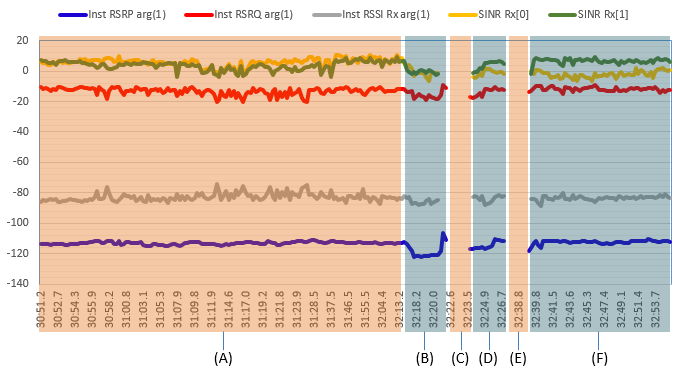
Figure 2. The same traces divided into periods A to F. The traces are missing in periods C and E, where the UE was not on LTE.
In (A), the difference between RSRP, RSRQ, SINR Rx(0), SINR Rx(1) are stay almost same and each of these traces stay same as well. Also, SINR Rx(0) and SINR Rx(1) are almost same (meaning the signal quality measured at primary Rx Antenna and secondary Rx Antenna are almost the same).
In (B), the difference between RSRP, RSRQ, SINR Rx(0), SINR Rx(1) are stay almost same and each of these traces stay same as well. But all of these values drops at the beginning and increase around the end of this section. Why ? From the signaling message from the same log, this is the section where UE camps on LTE Cell. But is there any correlation between LTE attach and RSRP/RSRQ/SINR drops ? As far as I know of, there would be no correlation.
In (C), all of the measurement disappears all of the sudden. Why ? You may easily guess two possible reason for this. Call drop or UE switched to other RAN (e.g, WCDMA Cell or GSM Cell). From the signaling log, this is where UE handovered to WCDMA Cell.
In (D), you see all the measurement appears again and the pattern is pretty similar to (A) and (B). The only small difference is that we see a little bit wider difference between SINR Rx(0) and SINR Rx(1). It means .. somehow the signal quality coming into the primary Reciever antenna is getting worse than the signal qualilty measured at the secondary reciever antenna. Why ? I don't know the answer. we need to look into other informations from the log or in some cases we may need to ask the exact measurement condition.
In (E), here we have another disappearance of the signal. Probably this is also due to the handover to other technology like WCDMA.
In (F), here we have the signal back, but here you see even more differences between SINR Rx(0) and SINR Rx(1). Why ? We don't know just from this plot.
Do you have any clear explanation for all of the plots shown above ? and do you have clear answers to all of the questions ("Why ?") in the description above ?
Don't worry, this is not to let you be under test. Even I don't have answers to all the questions. Some of the questions cannot be answered without additional information. This is just to let you think of various signal quality parameters and inter-relationship among them. For now, if you have questions (not the answers) about this, it is good enough.
One question can be answered from the plot alone, and it is a good check of Eq. 3. In period A, RSRP sits near -113 dBm, RSSI near -85 dBm and RSRQ near -12 dB. The dB form of Eq. 3 gives 10log10(N) = RSRQ - RSRP + RSSI = -12 + 113 - 85 = 16 dB. So N is about 40 RB, which is close to the 50 RB of a 10 MHz carrier. The log does not show the bandwidth here, so treat this as a consistency check and not as a measurement.
The SINR traces give a second check. Eq. 4 with β = 1 turns RSRQ = -12 dB into about -1 dB. But the SINR traces in period A sit near 5 dB. The full load relation from the equation section, SINR = 12 x RSRQ / (1 - 12 x RSRQ), gives about 5 dB from the same RSRQ. So the traces agree with the exact relation, and the simple Eq. 4 underestimates SINR at this level.
All traces stop together when the UE leaves LTE : a gap in only one trace would point to a measurement problem instead.RSRP, RSSI and RSRQ are tied by Eq. 3 : in period A they imply about 16 dB for 10log10(N).A growing gap between SINR Rx(0) and SINR Rx(1) is a per antenna effect : RSRP and RSRQ alone cannot show it.
Example 2 : RSRP/RSRQ at driving/handover situation
Following plot is from the data captured by a drive test tool Azenqos Drive Test tool (AZQ Android). I got the log captured by the tool and exported the data as csv file and then plot it on Microsoft Excel. The map displaying the path of the measurement shown at the bottom is the one automatically created by AZQ reporting tool.
You would see that RSRP changes pretty dynamically even along the pretty straight highway/open space. You see many changes PCI (Physical Cell ID) of serving cell, meaning the UE has gone through many Handovers.
The dots at lower parts of plot shows the RSRP of the neighbour cells. As you see, at most of the places where handover happens you would notice that there is a certain points where neighbour cell RSRP is higher than the serving cell RSRP, even though you would notice a couple of points where neigbour cell RSRP is greater than serving cell but handover does not happen.
In the plot below, the numbers along the top are the PCI of the serving cell. The alternating blue and yellow bands mark how long each PCI served the UE. The green trace near -10 dB is the serving RSRQ, and the red and orange trace is the serving RSRP. The dark dots are the neighbour RSRP measurements, and the map under the plot shows the route.
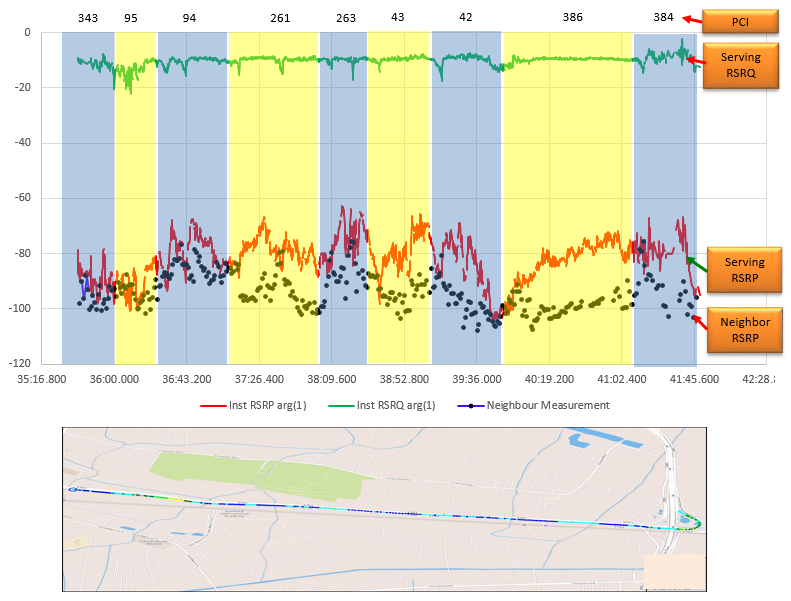
Figure 3. Serving RSRP and RSRQ with neighbour RSRP on a drive through nine serving cells. Serving RSRP swings by more than 30 dB, while serving RSRQ stays near -10 dB for most of the drive.
- The serving PCI runs 343, 95, 94, 261, 263, 43, 42, 386 and 384, so the UE made eight handovers.
- Inside one band, serving RSRP usually rises and then falls as the UE passes the cell. The handover comes near the end of the fall.
- Near most band boundaries, the neighbour dots reach the serving RSRP or rise above it. An RSRP based trigger such as event A3 reacts to exactly this, but the log alone does not show which event and offset the network configured.
- Serving RSRQ dips at some boundaries, for example near 36:00 and 39:36. At those points a neighbour arrives at almost the same RSRP, so the neighbour adds interference to RSSI and RSRQ falls.
This is why RSRQ is a useful second opinion during mobility. RSRP says how strong the serving cell is. RSRQ drops when another cell of similar strength is present, even when the serving RSRP has not changed much.
Handovers follow the neighbour RSRP : most of them happen where a neighbour reaches or passes the serving RSRP.RSRQ shows the cell border better than RSRP : its dips mark places where two cells arrive at similar power.
Example 3 : RSRP/RSRQ/RSSI/SINR at driving/handover situation
Following plot is from the data captured by a drive test tool Azenqos Drive Test tool (AZQ Android). I got the log captured by the tool and exported the data as csv file and then plot it on Microsoft Excel. The map displaying the path of the measurement shown at the bottom is the one automatically created by AZQ reporting tool.
Not much of new things to explain.. just try to make your own story based on the descriptions in previous sections / examples.
The plot below adds RSSI and SINR to the same kind of drive. The serving PCI labels run along the top, and the band colour changes at each handover. From top to bottom, the traces are SINR, RSRQ, RSSI and RSRP. The map colours the route by RSRP, using the ranges in its legend.
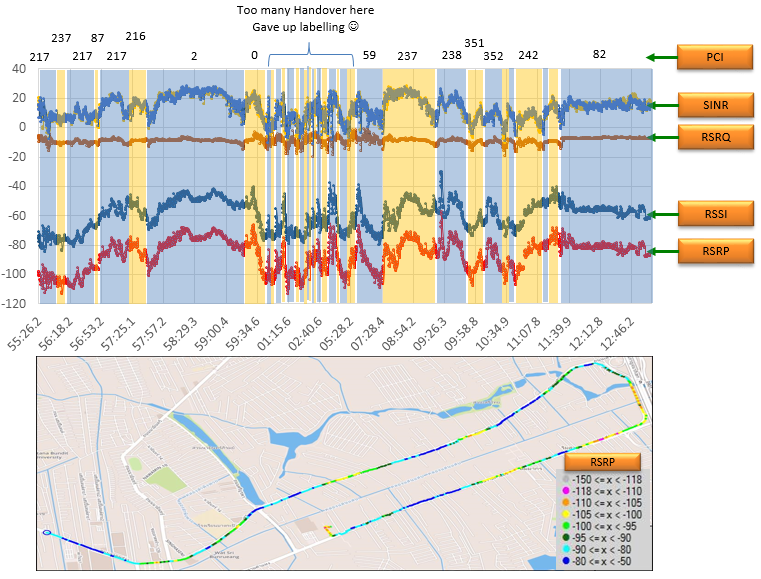
Figure 4. SINR, RSRQ, RSSI and RSRP on a drive with frequent handovers. RSSI and RSRP rise and fall together, RSRQ stays almost flat, and SINR drops where the handovers are densest.
- RSSI stays about 25 to 30 dB above RSRP for the whole drive. By the dB form of Eq. 3, this gap is 10log10(N) - RSRQ, and it stays steady because RSRQ is almost flat.
- SINR reaches 20 to 30 dB near PCI 2 and near the second PCI 237 band, where RSRP is also at its highest.
- In the stretch marked "Too many Handover here", SINR falls towards 0 dB. Several cells arrive at similar power there, so no single cell dominates and the UE hands over again and again.
- The map legend bins RSRP in steps from -150 dBm up to -50 dBm, with -80 dBm or higher in dark blue.
RSSI and RSRP move together : their gap changes only when RSRQ changes.SINR reacts more than RSRQ : it shows the interference in the dense handover stretch, where RSRQ moves only a little.Frequent handovers and low SINR appear together : both come from several cells at similar power.
Reference
[1] SINR, RSRP, RSSI AND RSRQ MEASUREMENTS IN LONG TERM EVOLUTION NETWORKS
Farhana Afroz, (1) Ramprasad Subramanian, (1) Roshanak Heidary, (1) Kumbesan Sandrasegaran
and (2) Solaiman Ahmed
(1) Faculty of Engineering and Information Technology, University of Technology, Sydney, Australia
(2) Department of Electrical and Electronic Engineering, University of Dhaka, Bangladesh
International Journal of Wireless & Mobile Networks (IJWMN) Vol. 7, No. 4, August 2015
[2] An On Filed Measurement Example
[3] What is the relationship between RSRP and SINR?
[4] Calculation of SINR, having the RSRQ
[5] Understanding LTE Signal Strength Values
[6] 36.214 v19.0.0 : E-UTRA Physical layer - Measurements. Clause 5.1.1 RSRP, clause 5.1.3 RSRQ, clause 5.1.23 RS-SINR.
[7] 36.331 v19.3.0 : E-UTRA Radio Resource Control - RRC; Protocol specification. RSRP-Range, RSRQ-Range, RSRQ-Type and RS-SINR-Range.
[8] 36.133 v19.5.0 : E-UTRA Requirements for support of radio resource management. Table 9.1.4-1 RSRP, Table 9.1.7-1 RSRQ and Table 9.1.17.1-1 RS-SINR measurement report mapping.