MatLab Toolbox - Phase Array System Home : www.sharetechnote.com
ULA (Uniform Linear Array)
ULA is the Object that is for design and simulating the set of antenna placed along a line. This is the type of array antenna that are used for MIMO (e.g, LTE MIMO).
- Basic Numerical Test
- Plotting Radiation Pattern in 2D
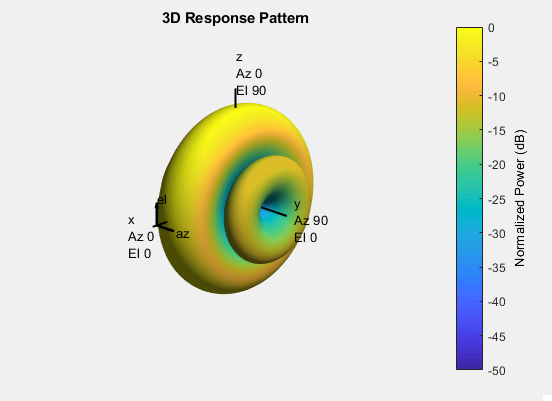
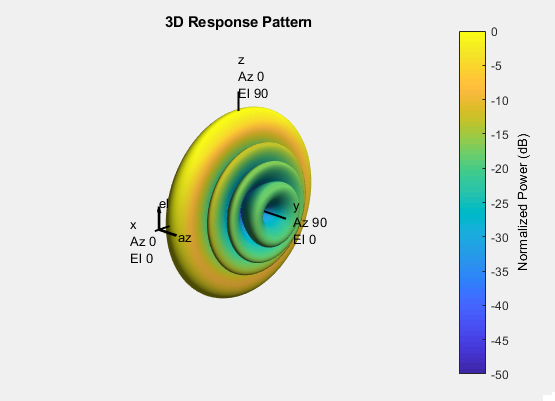
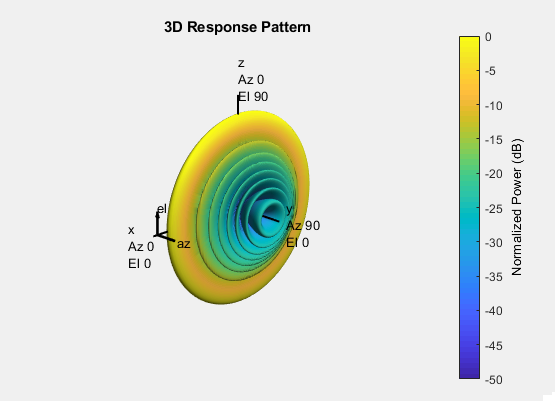
- Plotting Radiation Pattern in 3D
- Customer Steering
|
ULA_Basic_01.m |
|
c = 3e8; % propagation speed fc = 26e9; % carrier frequency lambda = c/fc; % wavelength
txarray = phased.ULA('NumElements',4,'ElementSpacing',lambda/2) txmipos = getElementPosition(txarray)/lambda
txarraystv = phased.SteeringVector('SensorArray',txarray,'PropagationSpeed',c)
txang = [0 ; 0]; wt = txarraystv(fc,txang)'
txbeam_ang = 0; txsv = steervec(txmipos,txbeam_ang)
txbeam = wt * txsv |
|
txang = [0 ; 0]; txbeam_ang = 0 |
|
txarray =
phased.ULA with properties:
Element: [1×1 phased.IsotropicAntennaElement] NumElements: 4 ElementSpacing: 0.0058 ArrayAxis: 'y' Taper: 1
txmipos =
0 0 0 0 -0.7500 -0.2500 0.2500 0.7500 0 0 0 0
txarraystv =
phased.SteeringVector with properties:
SensorArray: [1×1 phased.ULA] PropagationSpeed: 300000000 IncludeElementResponse: false NumPhaseShifterBits: 0
wt =
1 1 1 1
txsv =
1 1 1 1
txbeam =
4 |
|
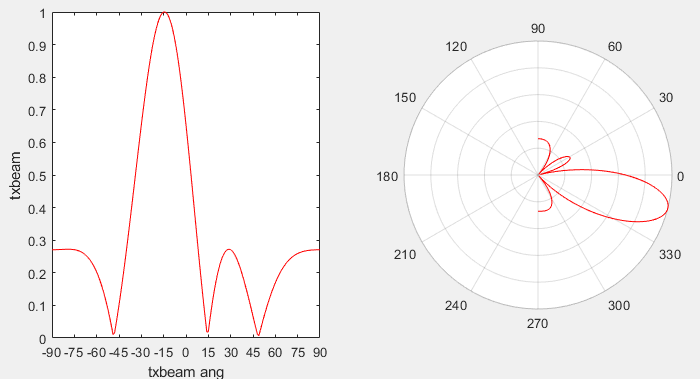
txang = [0 ; 0]; txbeam_ang = -10 |
|
txarray =
phased.ULA with properties:
Element: [1×1 phased.IsotropicAntennaElement] NumElements: 4 ElementSpacing: 0.0058 ArrayAxis: 'y' Taper: 1
txmipos =
0 0 0 0 -0.7500 -0.2500 0.2500 0.7500 0 0 0 0
txarraystv =
phased.SteeringVector with properties:
SensorArray: [1×1 phased.ULA] PropagationSpeed: 300000000 IncludeElementResponse: false NumPhaseShifterBits: 0
wt =
1 1 1 1
txsv =
0.6835 + 0.7300i 0.9630 + 0.2694i 0.9630 - 0.2694i 0.6835 - 0.7300i
txbeam =
3.2930 |
|
txang = [0 ; 0]; txbeam_ang = 10 |
|
txarray =
phased.ULA with properties:
Element: [1×1 phased.IsotropicAntennaElement] NumElements: 4 ElementSpacing: 0.0058 ArrayAxis: 'y' Taper: 1
txmipos =
0 0 0 0 -0.7500 -0.2500 0.2500 0.7500 0 0 0 0
txarraystv =
phased.SteeringVector with properties:
SensorArray: [1×1 phased.ULA] PropagationSpeed: 300000000 IncludeElementResponse: false NumPhaseShifterBits: 0
wt =
1 1 1 1
txsv =
0.6835 - 0.7300i 0.9630 - 0.2694i 0.9630 + 0.2694i 0.6835 + 0.7300i
txbeam =
3.2930 |
|
txang = [-10 ; 0]; txbeam_ang = 0 |
|
txarray =
phased.ULA with properties:
Element: [1×1 phased.IsotropicAntennaElement] NumElements: 4 ElementSpacing: 0.0058 ArrayAxis: 'y' Taper: 1
txmipos =
0 0 0 0 -0.7500 -0.2500 0.2500 0.7500 0 0 0 0
txarraystv =
phased.SteeringVector with properties:
SensorArray: [1×1 phased.ULA] PropagationSpeed: 300000000 IncludeElementResponse: false NumPhaseShifterBits: 0
wt =
0.6835 - 0.7300i 0.9630 - 0.2694i 0.9630 + 0.2694i 0.6835 + 0.7300i
txsv =
1 1 1 1
txbeam =
3.2930 |
|
txang = [10 ; 0]; txbeam_ang = 0 |
|
txarray =
phased.ULA with properties:
Element: [1×1 phased.IsotropicAntennaElement] NumElements: 4 ElementSpacing: 0.0058 ArrayAxis: 'y' Taper: 1
txmipos =
0 0 0 0 -0.7500 -0.2500 0.2500 0.7500 0 0 0 0
txarraystv =
phased.SteeringVector with properties:
SensorArray: [1×1 phased.ULA] PropagationSpeed: 300000000 IncludeElementResponse: false NumPhaseShifterBits: 0
wt =
0.6835 + 0.7300i 0.9630 + 0.2694i 0.9630 - 0.2694i 0.6835 - 0.7300i
txsv =
1 1 1 1
txbeam =
3.2930 |
Plotting Radiation Pattern in 2D
|
ULA_Basic_02.m |
|
c = 3e8; % propagation speed fc = 26e9; % carrier frequency lambda = c/fc; % wavelength NoOfTxAntenna = 4
txarray = phased.ULA('NumElements',NoOfTxAntenna,'ElementSpacing',lambda/2); txmipos = getElementPosition(txarray)/lambda;
txarraystv = phased.SteeringVector('SensorArray',txarray,'PropagationSpeed',c);
txang = [0 ; 0]; wt = txarraystv(fc,txang)';
txbeam_ang = -90:90; txbeam_ang_rad = (pi*txbeam_ang)/180; txbeam = abs(wt*steervec(txmipos,txbeam_ang)); txbeam = txbeam/max(txbeam); [txbeampos_x,txbeampos_y] = pol2cart(deg2rad(txbeam_ang),txbeam);
hFig = figure(1); set(hFig, 'Position', [0 0 800 400]); subplot(1,2,1); plot(txbeam_ang,txbeam,'r-'); xlabel('txbeam ang');ylabel('txbeam'); set(gca,'xtick',-90:15:90) xlim([txbeam_ang(1) txbeam_ang(end)]); ylim([0 1.0]); subplot(1,2,2); polarplot(txbeam_ang_rad,txbeam,'r'); set(gca,'RTickLabels',[]);
|
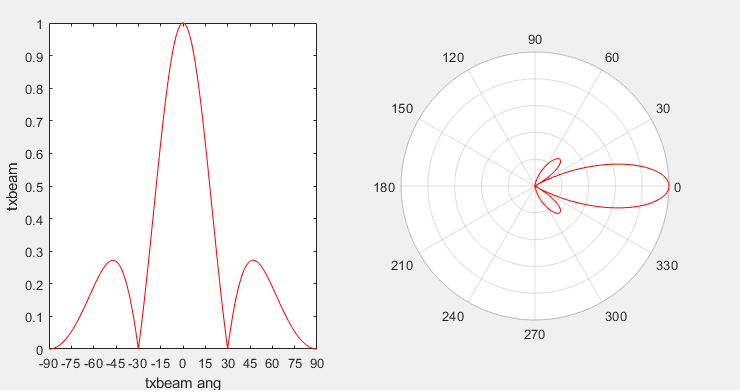
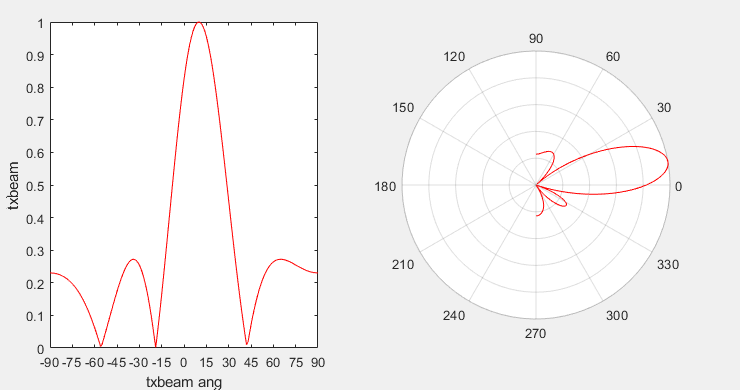
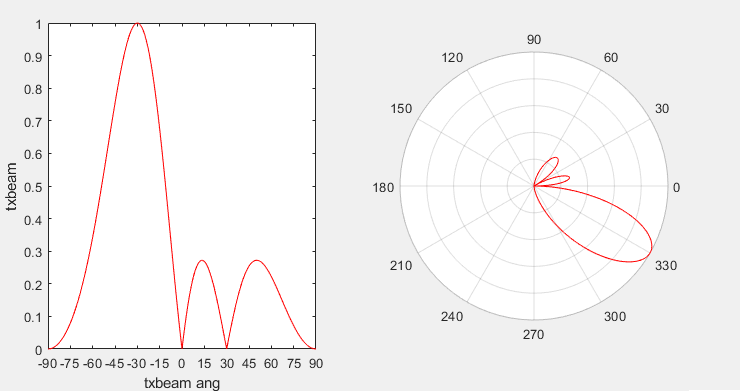
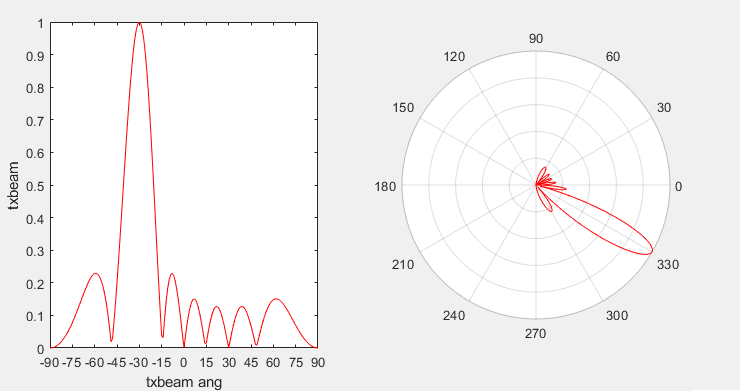
Following three example shows the beam pattern of the array antenna with 4 elements depending on different steering angles.
|
NoOfTxAntenna = 4 txang = [0 ; 0]; |
|
|
|
NoOfTxAntenna = 4 txang = [10 ; 0]; |
|
|
|
NoOfTxAntenna = 4 txang = [-30 ; 0]; |
|
|
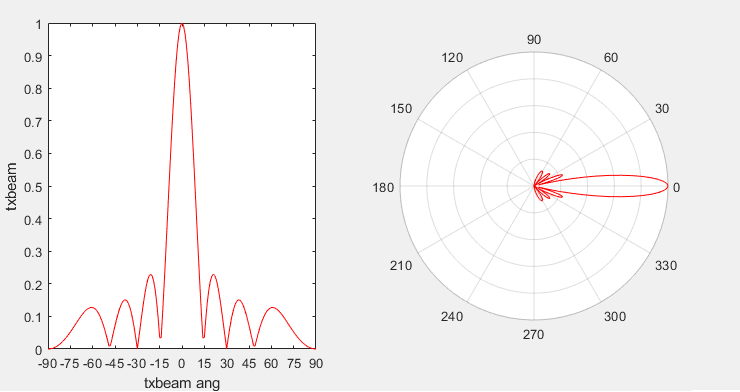
Following three example shows the beam pattern of the array antenna with 8 elements depending on different steering angles.
|
NoOfTxAntenna = 8 txang = [0 ; 0]; |
|
|
|
NoOfTxAntenna = 4 txang = [-30 ; 0]; |
|
|
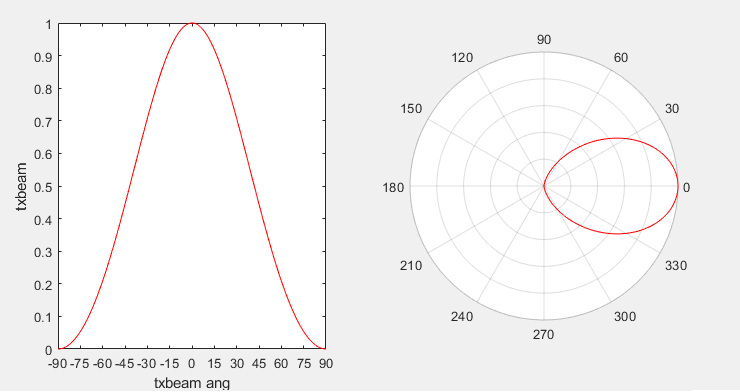
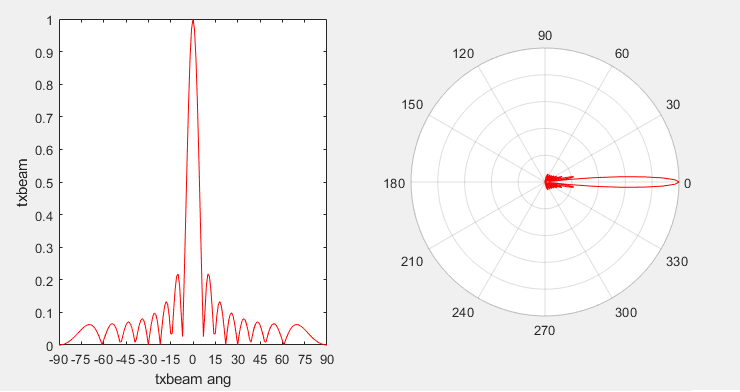
Following three example shows how the shape of the beam changes as the number of antenna elements in an array antenna gets larger.
|
NoOfTxAntenna = 2 txang = [0 ; 0]; |
|
|
|
NoOfTxAntenna = 2 txang = [0 ; 0]; |
|
|
|
NoOfTxAntenna = 8 txang = [0 ; 0]; |
|
|
|
NoOfTxAntenna = 16 txang = [0 ; 0]; |
|
|
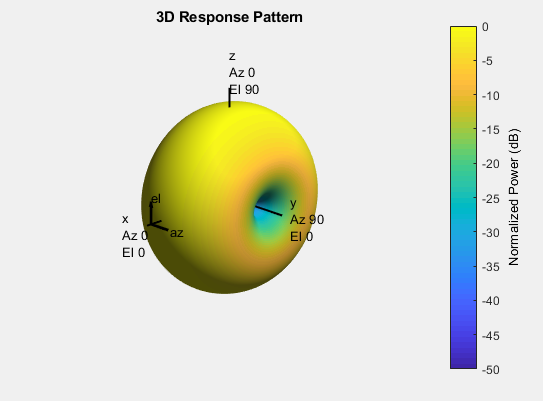
Plotting Radiation Pattern in 3D
|
ULA_Basic_03.m |
|
c = 3e8; % propagation speed fc = 26e9; % carrier frequency lambda = c/fc; % wavelength NoOfTxAntenna = 8
txarray = phased.ULA('NumElements',NoOfTxAntenna,'ElementSpacing',lambda/2);
pattern(txarray,fc,[-180:180],[-90:90],... 'PropagationSpeed',c,... 'CoordinateSystem','polar',... 'Type','powerdb')
|
|
NoOfTxAntenna = 2 |
|
|
|
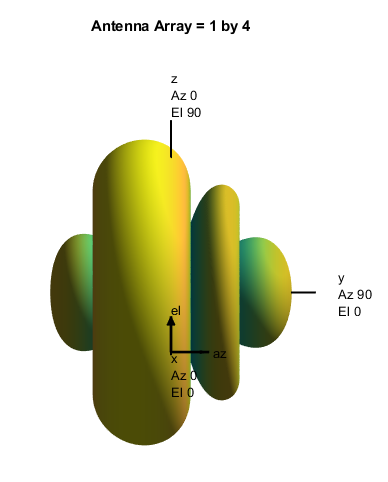
NoOfTxAntenna = 4 |
|
|
|
NoOfTxAntenna = 8 |
|
|
|
NoOfTxAntenna = 16 |
|
|
Steering with Custom Steering Vector
Followings are the examples that we define our own steering vector.
The steering vector in this example (marked red) came from a CSI codebook for NR. It is derived as explained here.
|
c = 3e8; % propagation speed fc = 26e9; % carrier frequency lambda = c/fc; % wavelength NoOfTxAntenna = 4;
antennaElement = phased.CrossedDipoleAntennaElement; txarray = phased.ULA('NumElements',NoOfTxAntenna,'ElementSpacing',lambda/2,'Element',antennaElement); txmipos = getElementPosition(txarray)/lambda;
txarraystv = phased.SteeringVector('SensorArray',txarray,'PropagationSpeed',c);
wt = [1 exp(j*pi/4) exp(j*pi/2) (exp(j*pi/2)*exp(j*pi/4))];
txbeam_ang = -90:90; txbeam_ang_rad = (pi*txbeam_ang)/180; txbeam = abs(wt*steervec(txmipos,txbeam_ang)); txbeam = txbeam/max(txbeam); [txbeampos_x,txbeampos_y] = pol2cart(deg2rad(txbeam_ang),txbeam);
hFig = figure(1); set(hFig, 'Position', [0 0 800 400]); subplot(1,2,1); plot(txbeam_ang,txbeam,'r-'); xlabel('txbeam ang');ylabel('txbeam'); set(gca,'xtick',-90:15:90) xlim([txbeam_ang(1) txbeam_ang(end)]); ylim([0 1.0]);
subplot(1,2,2); polarplot(txbeam_ang_rad,txbeam,'r'); set(gca,'RTickLabels',[]);
|
|
|
|
c = 3e8; % propagation speed fc = 26e9; % carrier frequency lambda = c/fc; % wavelength NoOfTxAntenna = 4;
txarray = phased.ULA('NumElements',NoOfTxAntenna,'ElementSpacing',lambda/2);
w = [1 exp(j*pi/4) exp(j*pi/2) (exp(j*pi/2)*exp(j*pi/4))]';
hFig = figure(1); pattern(txarray,fc,[-180:180],[-90:90],... 'PropagationSpeed',c,... 'CoordinateSystem','polar',... 'Type','powerdb', ... 'Weights',w)
set(gcf,'color','w');
view(90,20);
sTitle = sprintf("Antenna Array = %d by %d",1,NoOfTxAntenna); title(sTitle); set(hFig,'Position',[300 100 800 700]); |
|
|
Disclaimer ! :
This page is only to show you the overall logics and visualization for various Phase Array Antenna System. I haven't investigated much about verifying about the accuracy.
If you think the code is not so efficient, it is 100% my fault. I haven't made any effort for effiecient code. I just tried to create code as simple as possible for the readers. As you know, easy-to-read code is not always efficient for a specific chipset.
If you find any mistake in terms of accuracy, it is also very highly likely be my fault. Not the problem of Matlab tool box itself.
Any comment and corrections if you find any mistake will be welcome and appreciated.
