Matlab Toolbox - 4G/LTE
PCFICH
If you don't know what PCFICH(Physical Control Format Indicator Channel) is, refer to Physical Layer Channel : Downlink : PCFICH(Physical Control Format Indicator Channel) page first.
< Generating CFI codeword from CFI value >
This is the step to generate CFI codeword from CFI bit (basically it is converting a simple number like 1,2,3 into very complicated and long bits sequence). Matlab code is simple, just define an eNodeB and pass it to lteCFI() function.
% First you have to define properites of a eNodeB.
% NDLRB indicate System Bandwith in the unit of RBs.
% NDLRB 6 = 1.4 Mhz, NDLRB 15 = 3.0 Mhz, NDLRB 25 = 5.0 Mhz,
% NDLRB 50 = 10 Mhz, NDLRB 75 = 15 Mhz, NDLRB 100 = 20 Mhz
% CellRefP indicate number of downlink Antenna. CellRefP = 1 means 1 transmission antenna (SISO)
% NCellID indicate PCI (Physical Channel Identity) of the Cell
% NSubframe indicate the subframe number.
enb.CyclicPrefix = 'Normal';
enb.NDLRB = 6;
enb.CellRefP = 1;
enb.DuplexMode = 'FDD';
enb.NCellID = 0;
enb.NSubframe = 0;
enb.CFI = 1;
% pass eNodeB configuration to lteCFI() function and it will generate CFI codeword
cw = lteCFI(enb); % or you can simply do "cw = lteCFI(struct('CFI',1));" in which you don't have to define enb
cw'
Following example shows the generated CFI codeword from each possible CFI value. You would notice that this process generate always the same length of codeword (32 bits) regardless of CFI value.
Following is the generated CFI codeword from CFI number = 1.
|
enb.CFI = 1; |
|
|
0 1 1 0 1 1 0 1 1 0 1 1 0 1 1 0 1 1 0 1 1 0 1 1 0 1 1 0 1 1 0 1 |
|
Following is the generated CFI codeword from CFI number = 2
|
enb.CFI = 2; |
|
|
1 0 1 1 0 1 1 0 1 1 0 1 1 0 1 1 0 1 1 0 1 1 0 1 1 0 1 1 0 1 1 0 |
|
Following is the generated CFI codeword from CFI number = 3
|
enb.CFI = 3; |
|
|
1 1 0 1 1 0 1 1 0 1 1 0 1 1 0 1 1 0 1 1 0 1 1 0 1 1 0 1 1 0 1 1 |
|
< Generating PCFICH Symbol >
This is the process of generating PCFICH symbol from CFI Codeword. CFI codeword is always 32 bits and PCFICH is always using QPSK, so you would always get 16 physical layer symbols in this process.
% First you have to define properites of a eNodeB.
% NDLRB indicate System Bandwith in the unit of RBs.
% NDLRB 6 = 1.4 Mhz, NDLRB 15 = 3.0 Mhz, NDLRB 25 = 5.0 Mhz,
% NDLRB 50 = 10 Mhz, NDLRB 75 = 15 Mhz, NDLRB 100 = 20 Mhz
% CellRefP indicate number of downlink Antenna. CellRefP = 1 means 1 transmission antenna (SISO)
% NCellID indicate PCI (Physical Channel Identity) of the Cell
% NSubframe indicate the subframe number.
enb.CyclicPrefix = 'Normal';
enb.NDLRB = 6;
enb.CellRefP = 1;
enb.DuplexMode = 'FDD';
enb.NCellID = 0;
enb.NSubframe = 0;
enb.CFI = 1;
% pass eNodeB configuration to lteCFI() function and it will generate CFI codeword
cfi_cw = lteCFI(enb);
% pass CFI Codeword to ltePCFICH() function and it will generate PCFICH Symbols.
pcfich_sym = ltePCFICH(enb,cfi_cw);
pcfich_sym_arrayIndex = 0:length(pcfich_sym)-1;
% following is to display the symbols. First plot (left side) would show you the constellation and the second plot (right side) would give you I/Q value sequence.
subplot(1,3,1);
plot(real(pcfich_sym),imag(pcfich_sym),'ro','MarkerFaceColor',[1 0 0]);
title('Constellation');
subplot(1,3,[2 3]);
plot(pcfich_sym_arrayIndex,real(pcfich_sym),'ro-',pcfich_sym_arrayIndex,imag(pcfich_sym),'bo-');
xlim([0 max(pcfich_sym_arrayIndex)]);
title('PCFICH index vs PCFICH value. Red -> real, Blue -> Imaginary');
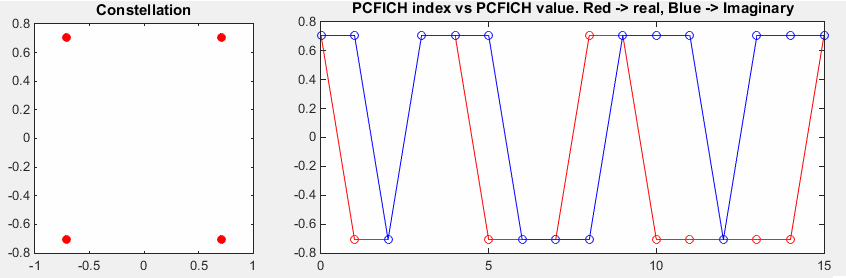
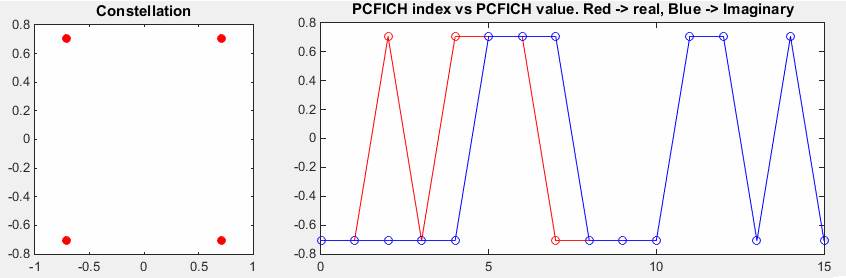
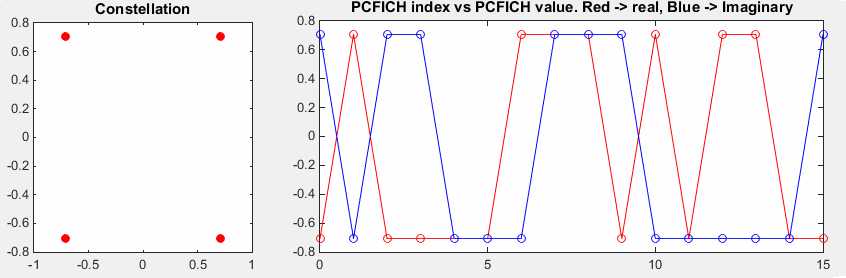
Following example shows the generated PCFICH symbols for each possible CFI value. You would notice that the number of PCFICH symbol is always 16 and the modulation scheme is always QPSK.
Following is the generated PCFICH symbol for CFI number = 1.
|
enb.CFI = 1; |
|
|
|
|
Following is the generated PCFICH symbol for CFI number = 2.
|
enb.CFI = 2; |
|
|
|
|
Following is the generated PCFICH symbol for CFI number = 3.
|
enb.CFI = 3; |
|
|
|
|
< PCFICH RE Mapping >
Now you have physical layer symbols for PCFICH and next step is to allocate each of those symbols on corresponding resource elements.
% First you have to define properites of a eNodeB.
% NDLRB indicate System Bandwith in the unit of RBs.
% NDLRB 6 = 1.4 Mhz, NDLRB 15 = 3.0 Mhz, NDLRB 25 = 5.0 Mhz,
% NDLRB 50 = 10 Mhz, NDLRB 75 = 15 Mhz, NDLRB 100 = 20 Mhz
% CellRefP indicate number of downlink Antenna. CellRefP = 1 means 1 transmission antenna (SISO)
% NCellID indicate PCI (Physical Channel Identity) of the Cell
% NSubframe indicate the subframe number.
enb.CyclicPrefix = 'Normal';
enb.NDLRB = 6;
enb.CellRefP = 1;
enb.DuplexMode = 'FDD';
enb.NCellID = 0;
enb.NSubframe = 0;
enb.CFI = 1;
% pass eNodeB configuration to lteCFI() function and it will generate CFI codeword
cfi_cw = lteCFI(enb);
% pass CFI Codeword to ltePCFICH() function and it will generate PCFICH Symbols.
pcfich_sym = ltePCFICH(enb,cfi_cw);
pcfich_sym_arrayIndex = 0:length(pcfich_sym)-1;
% Following is for figuring out the resource allocation number for each PCFICH symbol. this is pretty complciated/confusing process, but in the matlab toolbox just pass eNB config to ltePCFICHIndices() and this will give you all the resource element indices for all of the PCFICH symbols.
pcfich_sym_ind = ltePCFICHIndices(enb,{'1based','re'});
% Generate an empty resource grid for the whole one subframe.
resourceGrid = lteDLResourceGrid(enb);
% First I filled PSS, SSS, Cell RS into the resource grid because in real life, UE should detect these symbols before it try to decode PCFICH.
rs_Ant0_sym = lteCellRS(enb,0);
rs_Ant0_sym_ind = lteCellRSIndices(enb,0);
rs_Ant0_arrayIndex = 0:length(rs_Ant0_sym)-1;
pss = ltePSS(enb);
pss_arrayIndex = 0:length(pss)-1;
pss_sym_ind = ltePSSIndices(enb,0,{'1based','re'});
sss = lteSSS(enb);
sss_arrayIndex = 0:length(sss)-1;
sss_sym_ind = lteSSSIndices(enb,0,{'1based','re'});
% Following part is filling the resource grid with each of the signal.. but if you see carefully I didn't fill this with real
% symbol number, I just filled it with a constant that I arbitrarily set. This is just for visualization.. just to allocate
% constant/outstanding color for each signal. When you use this resource grid for real transmission, not for visualization,
% fill the resourceGrid with real symbol value you generated above.
pss_scale = 0.2;
sss_scale = 0.4;
rs_scale = 1.0;
pcfich_scale = 0.5;
resourceGrid(pss_sym_ind) = pss_scale;
resourceGrid(sss_sym_ind) = sss_scale;
resourceGrid(rs_Ant0_sym_ind) = rs_scale;
resourceGrid(pcfich_sym_ind) = pcfich_scale;
% Following is to display the resource grid. I didn't find any proper functions in the toolbox to display
% one subframe grid as I like. So I used a little bit of tricks. First I plot 3D surface graph with the grid and
% move the view point right on top of the plot so that it looks like plane 2D grid.
xStep = 0:13;
yStep = 0:(enb.NDLRB*12-1);
surface(xStep,yStep,abs(resourceGrid));
axis([0 13 0 (enb.NDLRB*12-1) 0 1]);
view([0,90]);
set(gca,'xtick',[0 6 7 13]);
set(gca,'ytick',[[0:12:enb.NDLRB*12-1] [enb.NDLRB*12-1]])
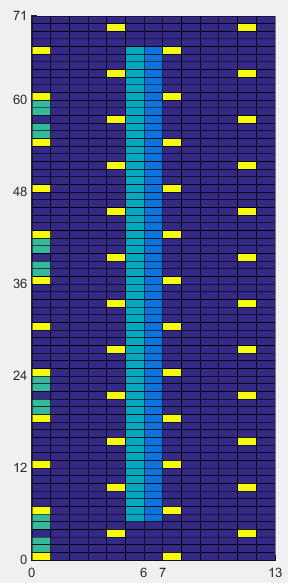
Followings are two example of PCFICH allocation for the same system bandwidth of 1.4 Mhz. The only difference between these two examples is Cell ID. The PCFICH position is the 'green' resource elements in the first symbol. Do you see any differences ? can you explain why you see the difference ?
|
enb.NCellID = 0; enb.NSubframe = 0; enb.NDLRB = 6; enb.CFI = 1; |
enb.NCellID = 1; enb.NSubframe = 0; enb.NDLRB = 6; enb.CFI = 1; |
|
|
|
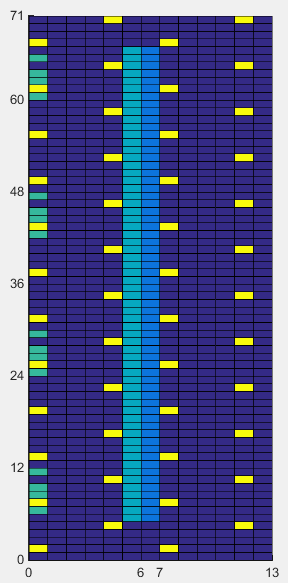
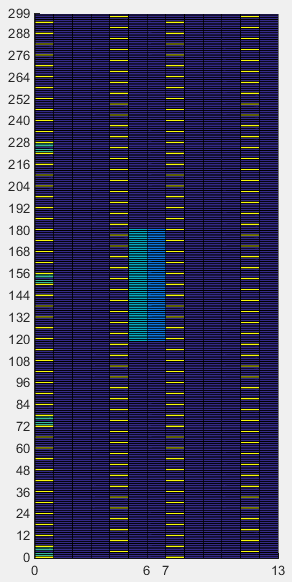
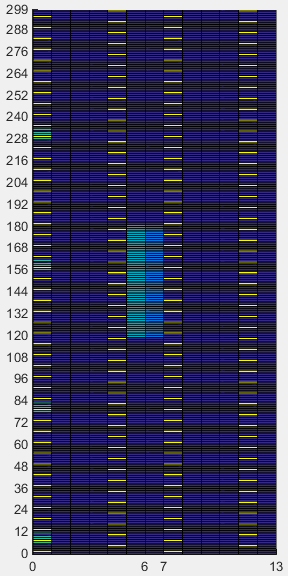
Followings are two example of PCFICH allocation for the same system bandwidth of 5 Mhz. The only difference between these two examples is Cell ID. The difference between this example and previous example is system bandwidth. The PCFICH position is the 'green' resource elements in the first symbol. If you count the number of green REs, it is same as in previous example. It means the number of PCFICH RE does not change with system BW. But you would notice the gap between each PCFICH REG(Resource Element Group) are different from previous example. Basic idea for PCFICH resource allocation is to distribute the 4 REGs as evenly as possible accross full system bandwidth.
|
enb.NCellID = 0; enb.NSubframe = 0; enb.NDLRB = 25; enb.CFI = 1; |
enb.NCellID = 1; enb.NSubframe = 0; enb.NDLRB = 25; enb.CFI = 1; |
|
|
|
Disclaimer ! :
This page is only to show you the overall logics and visualization for various LTE physical layer channels. I haven't investigated much about verifying about the accuracy.
If you think the code is not so efficient, it is 100% my fault. I haven't made any effort for effiecient code. I just tried to create code as simple as possible for the readers. As you know, easy-to-read code is not always efficient for a specific chipset.
If you find any mistake in terms of accuracy, it is also very highly likely be my fault. Not the problem of Matlab tool box itself.
Any comment and corrections if you find any mistake will be welcome and appreciated.