|
Data Throughput |
||
|
UMTS - CQI vs Throughput
In live network for HSDPA, Network sends data with different transport block size depending on CQI value reported by UE. For this mechanism to work properly, there should be a certain level of agreement between UE and the network about "which CQI value means which transport block size". These agreement is defined in the following tables of TS 25.214.
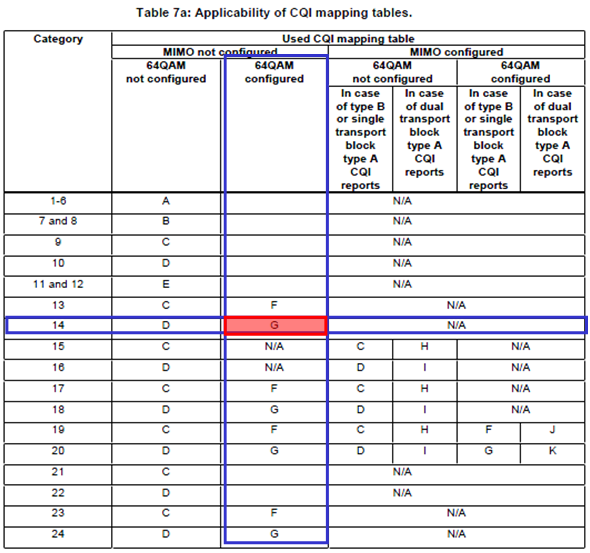
Then next question is which table do I have to use for which case ? The answer is in the following table from 24.214. As you see, we use different table depending on UE Category, Modulation Scheme, MIMO. For example, if a UE is Category 14 device and uses 64 QAM and does not use MIMO, it use Table G for CQI-Transport Block Size Mapping as shown below.
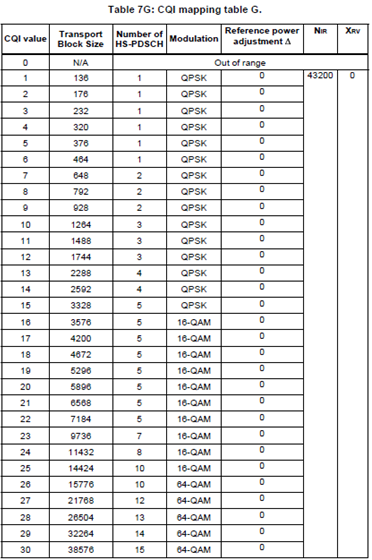
I put Table 7G as an example. As you see in the table, the range of CQI value is 0~30. 30 means the best channel quality and lower number indicates poorer channel quality. And Network has to send the data with the proper transport block size according to the CQI values. For example, i) If UE report CQI value 15, it is expected for Network to send data with transport block size of 3328 bits/TTI which is equivalent to around 1.6 Mbps. ii) If UE report CQI value 30, it is expected for Network to send data with transport block size of 38576 bits/TTI which is equivalent to around 19 Mbps.
One thing you would notice that the transport block size for the highest CQI value is not amount to the ideal MAX throughput defined in 25.306 Table 5.1a. It implies that you wouldn't get the ideal Max throughput in any case with live network condition which may operate according to the CQI table defined in 3GPP. (It would not be any problem in real communication environment since your device would not report CQI 30 in most case).
However, many UE manufacturer/developer wants to see if their device can really reach the ideal max throughput. In that case, we normally use a special network simulator which allows us to set the largest transport block size for each UE category. It would be even better if the network simulator allows us to define CQI-transport block mapping table arbitrarily. Fortunately I have access to this kind of the equipment and I did an experiment as shown below using the network simulator and a HSDPA Category 10 UE.
First I defined a CQI-transport block size table very similar to Table 7D, but I changed the tranport block size for high end CQI (30, 29, 28, 27) to allocate larger tranport block than the ones specified in Table 7D to push the ideal MAX throughput. I programmed Network Simulator so that I decrease the downlink power by a certain steps. As downlink power (Cell Power) gets down, UE would report lower CQI and Network Simulator would transmit lower transport block size. The result is as follows. In the upper plot, you see three traces - Green, Red, Blue. Green trace means the everage CQI value within 500ms that UE reported. Red trace indicates the the amount of data in Kbps that the network emulator transmitted to UE within a second. Blue trace indicates the amount of data in Kbps that UE successfully decoded. If the Red trace and Blue traces overlaps, it implies that UE successfully decoded all the data transmitted by the network. If the Blue trace is lower than the Red Trace, UE failed to decode some of the data transmitted by the network. The black line shown in section A, B, C is the data rate defined in Table 7D, but I intentionally allocated the higher data rate for section A,B,C to push the data rate closer to the ideal Max throughput. In the lower plot, you see three traces - Green, Red, Blue. Green trace means the everage CQI value within 500ms that UE reported. Red trace indicates the amount of ACKs within 500 ms and Blue trace indicates the amount of NACKs within 500 ms.
There are a couple of things you may notice (The notes here may be different from what you observed from your device and test setting) i) Section A is the only region in which UE shows 100% data decoding without any failure. It means that you have to make it sure that your test equipment configuration, cable connection between the test equipment and UE is configured properly so that the channel quality belongs to this area. (I would say "CQI should be much higher than 30". I know 30 is the max CQI value. What I mean is that the channel quality should be much better than the quality in which UE barely reports CQI 30). ii) In Section B, you see huge drops in terms of throughput and huge increase in terms of number of NACKs. Main reason would be that I allocated too large transport block size for CQI 29, 28. There would also be some UE issues with this range. Section C,D,E shows a kind of normal trends, but ideally we should expect exact overlapping of rad trace and blue trace, but reality never goes like ideal -:)
|
||