LTE UL (SC-FDMA) Demodulation
In this page, I will show you how OFDM demodulation works by using 'semi-real data'. By semi-real, I mean that the data that I used here is not from live eNB but generated by a real hardware (Vector signal generator) and captured by Vector Signal Analyzer with special Sync signal. So you don't have to implement an algorithm for synchronization and a lot of compensation which is a too much for an example. If you are interested in working as beginner level of LTE DSP, this can be helpful or motivation as well.
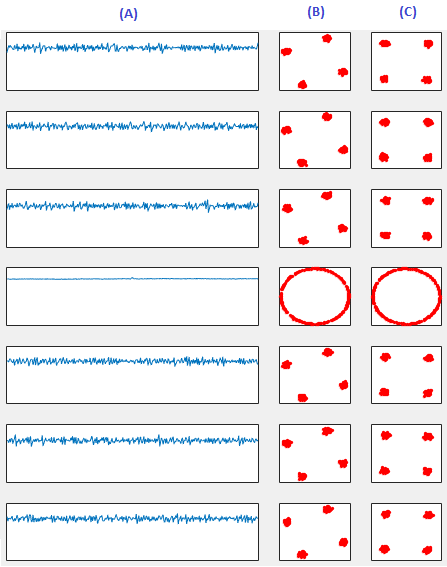
Following is the result of the Matlab source code listed here. (A) shows the frequency domain result for each symbols within the first slot of subframe 0. (B) is the I/Q plot (real and imaginary) representation of column (A). You would notice some degree of rotation (phase shift). (C) is the result after phase compensation of column (B).
The data that I used in this example is from following LTE Configuration.
- System BandWidth = 5 Mhz
- Number of RB = 50
- Physical Cell ID = 0
- Sampling Rate = 7.68 Mhz
Following is the Matlab source code that produced the figure shown above. The code is designed intentionally long. I might have make it very short if I used for-loop, but it would look harder to understand. So I try to write every procedure step by step. Hopefully, this would be easier for you to follow even though it looks a little too lengthy.
clear all;
% you can download the data file in this example from here.
% this is for reading the baseband IQ data of OFDM symbol in time domain.
% detailed explantion for this three line and file format in this example is described in
% Matlab : Read Number in Binary file page.
fid = fopen('UL_5_25_NoFilter_S7_68_Trig.bin','r');
[data,count] = fread(fid, 'single');
fclose(fid);
% This variable represents the first sample in the first SCFDM symbol.
% How do I know this ? This is just a magic number I could figure out from the vector signal
% analyzer. Just think this is just a given number. If you seriously want to work in this
% area, try to implement the algorithm to find this number on your own.
Offset = 280228;
% Nfft represents the FFT size for the specified system bandwidth. 512 is the FFT size for
% 5 Mhz System Bandwidth.
Nfft = 512;
% N_RB is the number of RB assinged to this signal. N_RE is the number of Resource Elements
% in this signal and can be calculated from N_RB. This N_RE determines the IFFT size in
% demodulation process (N_RE is the size of IFFT)
N_RB = 25;
N_RE = N_RB * 12;
% SamplingScale is to figure out the number of samples in CP and OFDM Symbol for each specific system
% Bandwidth from the 20 Mhz Bandwidth. Physical Layer Parameters - FDD, Downlink will help you understand
% the meaning of each numbers here.
SamplingScale = (double(Nfft)/2048);
CP_LengthList = SamplingScale * [160;144;144;144;144;144;144];
Symbol_LengthList = SamplingScale * [2048;2048;2048;2048;2048;2048;2048];
% This is to compensate the phase rotation shown in track (B) of the result.
% How do I figure out this number. I just got it by eye balling and a couple of try and error.
% If you seriously want to work in this area, try to implement the algorithm to find this
% number on your own.
PhaseOffset = exp(-j*pi/8);
% This is to generate a complex numbered sequence to shift the frequency of the I/Q signal by 7.5 Khz
% the number of samples of this data is same as the number of samples of each SC-FDM symbol.
Ts = 1.0/(7.68 * 10^6);
t = linspace(0,Nfft-1,Nfft);
t = t .* Ts;
Fshift = 7.5 * 1000 ;
FrequencyShift = exp(j*2*pi*Fshift*t);
%%%%%%%%%%%%%%%%%%%%%%%%%%%%%% Demodulation of symbol 0 %%%%%%%%%%%%%%%%%%%%%%%%%%%%%%%%%%%
% This is to demoulate the symbol 0 within the slot 0 of Subframe 0.
% ChuckStart here indicates the index(position) of the first sample within the binary file.
% You would notice that I skip the first CP length. This is the same effect of removing the
% first CP as described in CP removal described in RE Map to/from Antenna page.
ChunkStart = Offset ...
+ CP_LengthList(1);
% This variable indicates the number of samples within the first OFDM symbol excluding the CP
ChunkLength = Symbol_LengthList(1);
% This is to read I/Q data pair.
DataChunk = data((2.* ChunkStart)-1 : (2.*(ChunkStart+ChunkLength)-2));
% This is to separate I and Q into a separate array (vector)
DataChunkI = DataChunk(1:2:length(DataChunk));
DataChunkQ = DataChunk(2:2:length(DataChunk));
% This is to combine I array and Q array into a complex number array.
DataChunkComplex = DataChunkI + j*DataChunkQ;
% This is to convert the time domain OFDM symbol into the frequency domain. Note that the data
% is shifted in frequency domain
DataChunkFFT = fft(DataChunkComplex .* FrequencyShift');
% This is to take out the data samples which will be mapped to each resource element
% within the symbol
DataChunkFFT_RE = [DataChunkFFT(end-(N_RE/2-1):end)' DataChunkFFT(1:N_RE/2)'];
% This is to perform the subcarrier demapping (converting each symboles of resource elements
% to original binary data
DataChunkFFT_IFFT = ifft(DataChunkFFT_RE);
DataChunkFFT_IFFT = DataChunkFFT_IFFT/max(abs(DataChunkFFT_IFFT));
DataChunkFFT_IFFT = DataChunkFFT_IFFT;
DataChunkFftMag = abs(DataChunkFFT_IFFT);
% This is to plot the IFFT result in magnitude.
% The result of this block is shown in track (A) of the figure at the beginning of the page
subplot(7,5,[1 3]);
plot(DataChunkFftMag);xlim([1, length(DataChunkFftMag)]); ylim([0 1.2]);
set(gca,'xticklabel',[]);set(gca,'yticklabel',[]);
set(gca,'xtick',[]);set(gca,'ytick',[]);
% This is to plot the IFFT result in complex domain (I and Q axis)
% The result of this block is shown in track (B) of the figure at the beginning of the page
subplot(7,5,4);
plot(real(DataChunkFFT_IFFT),imag(DataChunkFFT_IFFT),'ro','MarkerFaceColor',[1 0 0],'MarkerSize',2);
xlim([-1 1]);ylim([-1 1]);
set(gca,'xticklabel',[]);set(gca,'yticklabel',[]);
set(gca,'xtick',[]);set(gca,'ytick',[]);
% This is to plot the FFT result rotated by the angle specified by the variable PhaseOffset
% The result of this block is shown in track (C) of the figure at the beginning of the page
subplot(7,5,5);
DataChunkFFT_Comp = DataChunkFFT_IFFT .* PhaseOffset;
plot(real(DataChunkFFT_Comp),imag(DataChunkFFT_Comp),'ro','MarkerFaceColor',[1 0 0],'MarkerSize',2);
xlim([-1 1]);ylim([-1 1]);
set(gca,'xticklabel',[]);set(gca,'yticklabel',[]);
set(gca,'xtick',[]);set(gca,'ytick',[]);
%%%%%%%%%%%%%%%%%%%%%%%%%%%%%% Demodulation of symbol 1 %%%%%%%%%%%%%%%%%%%%%%%%%%%%%%%%%%%
% This is to demodulate the symbol 1 within the slot 0 of Subframe 0. Everything is same
% as in the symbol 0 analysis except the 'ChunkStart. So I would not explain any further.
ChunkStart = Offset ...
+ CP_LengthList(1) + Symbol_LengthList(1) ...
+ CP_LengthList(2) ;
ChunkLength = Symbol_LengthList(2);
DataChunk = data((2.* ChunkStart)-1 : (2.*(ChunkStart+ChunkLength)-2));
DataChunkI = DataChunk(1:2:length(DataChunk));
DataChunkQ = DataChunk(2:2:length(DataChunk));
DataChunkComplex = DataChunkI + j*DataChunkQ;
DataChunkFFT = fft(DataChunkComplex .* FrequencyShift');
DataChunkFFT_RE = [DataChunkFFT(end-(N_RE/2-1):end)' DataChunkFFT(1:N_RE/2)'];
DataChunkFFT_IFFT = ifft(DataChunkFFT_RE);
DataChunkFFT_IFFT = DataChunkFFT_IFFT/max(abs(DataChunkFFT_IFFT));
DataChunkFFT_IFFT = DataChunkFFT_IFFT;
DataChunkFftMag = abs(DataChunkFFT_IFFT);
subplot(7,5,[6 8]);
plot(DataChunkFftMag);xlim([1, length(DataChunkFftMag)]); ylim([0 1.2]);
set(gca,'xticklabel',[]);set(gca,'yticklabel',[]);
set(gca,'xtick',[]);set(gca,'ytick',[]);
subplot(7,5,9);
plot(real(DataChunkFFT_IFFT),imag(DataChunkFFT_IFFT),'ro','MarkerFaceColor',[1 0 0],'MarkerSize',2);
xlim([-1 1]);ylim([-1 1]);
set(gca,'xticklabel',[]);set(gca,'yticklabel',[]);
set(gca,'xtick',[]);set(gca,'ytick',[]);
subplot(7,5,10);
DataChunkFFT_Comp = DataChunkFFT_IFFT .* PhaseOffset;
plot(real(DataChunkFFT_Comp),imag(DataChunkFFT_Comp),'ro','MarkerFaceColor',[1 0 0],'MarkerSize',2);
xlim([-1 1]);ylim([-1 1]);
set(gca,'xticklabel',[]);set(gca,'yticklabel',[]);
set(gca,'xtick',[]);set(gca,'ytick',[]);
%%%%%%%%%%%%%%%%%%%%%%%%%%%%%% Demodulation of symbol 2 %%%%%%%%%%%%%%%%%%%%%%%%%%%%%%%%%%%
% This is to demodulate the symbol 2 within the slot 0 of Subframe 0. Everything is same
% as in the symbol 0 analysis except the 'ChunkStart. So I would not explain any further.
ChunkStart = Offset ...
+ CP_LengthList(1) + Symbol_LengthList(1) ...
+ CP_LengthList(2) + Symbol_LengthList(2) ...
+ CP_LengthList(3);
ChunkLength = Symbol_LengthList(3);
DataChunk = data((2.* ChunkStart)-1 : (2.*(ChunkStart+ChunkLength)-2));
DataChunkI = DataChunk(1:2:length(DataChunk));
DataChunkQ = DataChunk(2:2:length(DataChunk));
DataChunkComplex = DataChunkI + j*DataChunkQ;
DataChunkFFT = fft(DataChunkComplex .* FrequencyShift');
DataChunkFFT_RE = [DataChunkFFT(end-(N_RE/2-1):end)' DataChunkFFT(1:N_RE/2)'];
DataChunkFFT_IFFT = ifft(DataChunkFFT_RE);
DataChunkFFT_IFFT = DataChunkFFT_IFFT/max(abs(DataChunkFFT_IFFT));
DataChunkFFT_IFFT = DataChunkFFT_IFFT;
DataChunkFftMag = abs(DataChunkFFT_IFFT);
subplot(7,5,[11 13]);
plot(DataChunkFftMag);xlim([1, length(DataChunkFftMag)]); ylim([0 1.2]);
set(gca,'xticklabel',[]);set(gca,'yticklabel',[]);
set(gca,'xtick',[]);set(gca,'ytick',[]);
subplot(7,5,14);
plot(real(DataChunkFFT_IFFT),imag(DataChunkFFT_IFFT),'ro','MarkerFaceColor',[1 0 0],'MarkerSize',2);
xlim([-1 1]);ylim([-1 1]);
set(gca,'xticklabel',[]);set(gca,'yticklabel',[]);
set(gca,'xtick',[]);set(gca,'ytick',[]);
subplot(7,5,15);
DataChunkFFT_Comp = DataChunkFFT_IFFT .* PhaseOffset;
plot(real(DataChunkFFT_Comp),imag(DataChunkFFT_Comp),'ro','MarkerFaceColor',[1 0 0],'MarkerSize',2);
xlim([-1 1]);ylim([-1 1]);
set(gca,'xticklabel',[]);set(gca,'yticklabel',[]);
set(gca,'xtick',[]);set(gca,'ytick',[]);
%%%%%%%%%%%%%%%%%%%%%%%%%%%%%% Demodulation of symbol 3 %%%%%%%%%%%%%%%%%%%%%%%%%%%%%%%%%%%
% This is to demodulate the symbol 3 within the slot 0 of Subframe 0. The symbol 3(the fourth
% symbol in LTE UL slot is special. It is special symbol carrying PUSCH DMRS data, it does
% not carry any user data. It just carries special reference signal based on Zad-off Chu
% sequence. This signal does not go through transformation procoding when it is transmitted
% so this does not go through IFFT process when it is demodulated. But I am still using the
% variable xxxx_IFFT in this step as I used for other symbols.
ChunkStart = Offset ...
+ CP_LengthList(1) + Symbol_LengthList(1) ...
+ CP_LengthList(2) + Symbol_LengthList(2) ...
+ CP_LengthList(3) + Symbol_LengthList(3) ...
+ CP_LengthList(4);
ChunkLength = Symbol_LengthList(4);
DataChunk = data((2.* ChunkStart)-1 : (2.*(ChunkStart+ChunkLength)-2));
DataChunkI = DataChunk(1:2:length(DataChunk));
DataChunkQ = DataChunk(2:2:length(DataChunk));
DataChunkComplex = DataChunkI + j*DataChunkQ;
DataChunkFFT = fft(DataChunkComplex .* FrequencyShift');
DataChunkFFT_RE = [DataChunkFFT(end-(N_RE/2-1):end)' DataChunkFFT(1:N_RE/2)'];
DataChunkFFT_IFFT = DataChunkFFT_RE;
DataChunkFFT_IFFT = DataChunkFFT_IFFT/max(abs(DataChunkFFT_IFFT));
DataChunkFFT_IFFT = DataChunkFFT_IFFT;
DataChunkFftMag = abs(DataChunkFFT_IFFT);
subplot(7,5,[16 18]);
plot(DataChunkFftMag);xlim([1, length(DataChunkFftMag)]); ylim([0 1.2]);
set(gca,'xticklabel',[]);set(gca,'yticklabel',[]);
set(gca,'xtick',[]);set(gca,'ytick',[]);
subplot(7,5,19);
plot(real(DataChunkFFT_IFFT),imag(DataChunkFFT_IFFT),'ro','MarkerFaceColor',[1 0 0],'MarkerSize',2);
xlim([-1 1]);ylim([-1 1]);
set(gca,'xticklabel',[]);set(gca,'yticklabel',[]);
set(gca,'xtick',[]);set(gca,'ytick',[]);
subplot(7,5,20);
DataChunkFFT_Comp = DataChunkFFT_IFFT .* PhaseOffset;
plot(real(DataChunkFFT_Comp),imag(DataChunkFFT_Comp),'ro','MarkerFaceColor',[1 0 0],'MarkerSize',2);
xlim([-1 1]);ylim([-1 1]);
set(gca,'xticklabel',[]);set(gca,'yticklabel',[]);
set(gca,'xtick',[]);set(gca,'ytick',[]);
%%%%%%%%%%%%%%%%%%%%%%%%%%%%%% Demodulation of symbol 4 %%%%%%%%%%%%%%%%%%%%%%%%%%%%%%%%%%%
% This is to demodulate the symbol 4 within the slot 0 of Subframe 0. Everything is same
% as in the symbol 0 analysis except the 'ChunkStart. So I would not explain any further.
ChunkStart = Offset ...
+ CP_LengthList(1) + Symbol_LengthList(1) ...
+ CP_LengthList(2) + Symbol_LengthList(2) ...
+ CP_LengthList(3) + Symbol_LengthList(3) ...
+ CP_LengthList(4) + Symbol_LengthList(4) ...
+ CP_LengthList(5);
ChunkLength = Symbol_LengthList(5);
DataChunk = data((2.* ChunkStart)-1 : (2.*(ChunkStart+ChunkLength)-2));
DataChunkI = DataChunk(1:2:length(DataChunk));
DataChunkQ = DataChunk(2:2:length(DataChunk));
DataChunkComplex = DataChunkI + j*DataChunkQ;
DataChunkFFT = fft(DataChunkComplex .* FrequencyShift');
DataChunkFFT_RE = [DataChunkFFT(end-(N_RE/2-1):end)' DataChunkFFT(1:N_RE/2)'];
DataChunkFFT_IFFT = ifft(DataChunkFFT_RE);
DataChunkFFT_IFFT = DataChunkFFT_IFFT/max(abs(DataChunkFFT_IFFT));
DataChunkFFT_IFFT = DataChunkFFT_IFFT;
DataChunkFftMag = abs(DataChunkFFT_IFFT);
subplot(7,5,[21 23]);
plot(DataChunkFftMag);xlim([1, length(DataChunkFftMag)]); ylim([0 1.2]);
set(gca,'xticklabel',[]);set(gca,'yticklabel',[]);
set(gca,'xtick',[]);set(gca,'ytick',[]);
subplot(7,5,24);
plot(real(DataChunkFFT_IFFT),imag(DataChunkFFT_IFFT),'ro','MarkerFaceColor',[1 0 0],'MarkerSize',2);
xlim([-1 1]);ylim([-1 1]);
set(gca,'xticklabel',[]);set(gca,'yticklabel',[]);
set(gca,'xtick',[]);set(gca,'ytick',[]);
subplot(7,5,25);
DataChunkFFT_Comp = DataChunkFFT_IFFT .* PhaseOffset;
plot(real(DataChunkFFT_Comp),imag(DataChunkFFT_Comp),'ro','MarkerFaceColor',[1 0 0],'MarkerSize',2);
xlim([-1 1]);ylim([-1 1]);
set(gca,'xticklabel',[]);set(gca,'yticklabel',[]);
set(gca,'xtick',[]);set(gca,'ytick',[]);
%%%%%%%%%%%%%%%%%%%%%%%%%%%%%% Demodulation of symbol 5 %%%%%%%%%%%%%%%%%%%%%%%%%%%%%%%%%%%
% This is to demodulate the symbol 5 within the slot 0 of Subframe 0. Everything is same
% as in the symbol 0 analysis except the 'ChunkStart. So I would not explain any further.
ChunkStart = Offset ...
+ CP_LengthList(1) + Symbol_LengthList(1) ...
+ CP_LengthList(2) + Symbol_LengthList(2) ...
+ CP_LengthList(3) + Symbol_LengthList(3) ...
+ CP_LengthList(4) + Symbol_LengthList(4) ...
+ CP_LengthList(5) + Symbol_LengthList(5) ...
+ CP_LengthList(6);
ChunkLength = Symbol_LengthList(6);
DataChunk = data((2.* ChunkStart)-1 : (2.*(ChunkStart+ChunkLength)-2));
DataChunkI = DataChunk(1:2:length(DataChunk));
DataChunkQ = DataChunk(2:2:length(DataChunk));
DataChunkComplex = DataChunkI + j*DataChunkQ;
DataChunkFFT = fft(DataChunkComplex .* FrequencyShift');
DataChunkFFT_RE = [DataChunkFFT(end-(N_RE/2-1):end)' DataChunkFFT(1:N_RE/2)'];
DataChunkFFT_IFFT = ifft(DataChunkFFT_RE);
DataChunkFFT_IFFT = DataChunkFFT_IFFT/max(abs(DataChunkFFT_IFFT));
DataChunkFFT_IFFT = DataChunkFFT_IFFT;
DataChunkFftMag = abs(DataChunkFFT_IFFT);
subplot(7,5,[26 28]);
plot(DataChunkFftMag);xlim([1, length(DataChunkFftMag)]); ylim([0 1.2]);
set(gca,'xticklabel',[]);set(gca,'yticklabel',[]);
set(gca,'xtick',[]);set(gca,'ytick',[]);
subplot(7,5,29);
plot(real(DataChunkFFT_IFFT),imag(DataChunkFFT_IFFT),'ro','MarkerFaceColor',[1 0 0],'MarkerSize',2);
xlim([-1 1]);ylim([-1 1]);
set(gca,'xticklabel',[]);set(gca,'yticklabel',[]);
set(gca,'xtick',[]);set(gca,'ytick',[]);
subplot(7,5,30);
DataChunkFFT_Comp = DataChunkFFT_IFFT .* PhaseOffset;
plot(real(DataChunkFFT_Comp),imag(DataChunkFFT_Comp),'ro','MarkerFaceColor',[1 0 0],'MarkerSize',2);
xlim([-1 1]);ylim([-1 1]);
set(gca,'xticklabel',[]);set(gca,'yticklabel',[]);
set(gca,'xtick',[]);set(gca,'ytick',[]);
%%%%%%%%%%%%%%%%%%%%%%%%%%%%%% Demodulation of symbol 6 %%%%%%%%%%%%%%%%%%%%%%%%%%%%%%%%%%%
% This is to demodulate the symbol 6 within the slot 0 of Subframe 0. Everything is same
% as in the symbol 0 analysis except the 'ChunkStart. So I would not explain any further.
ChunkStart = Offset ...
+ CP_LengthList(1) + Symbol_LengthList(1) ...
+ CP_LengthList(2) + Symbol_LengthList(2) ...
+ CP_LengthList(3) + Symbol_LengthList(3) ...
+ CP_LengthList(4) + Symbol_LengthList(4) ...
+ CP_LengthList(5) + Symbol_LengthList(5) ...
+ CP_LengthList(6) + Symbol_LengthList(6) ...
+ CP_LengthList(7);
ChunkLength = Symbol_LengthList(7);
DataChunk = data((2.* ChunkStart)-1 : (2.*(ChunkStart+ChunkLength)-2));
DataChunkI = DataChunk(1:2:length(DataChunk));
DataChunkQ = DataChunk(2:2:length(DataChunk));
DataChunkComplex = DataChunkI + j*DataChunkQ;
DataChunkFFT = fft(DataChunkComplex .* FrequencyShift');
DataChunkFFT_RE = [DataChunkFFT(end-(N_RE/2-1):end)' DataChunkFFT(1:N_RE/2)'];
DataChunkFFT_IFFT = ifft(DataChunkFFT_RE);
DataChunkFFT_IFFT = DataChunkFFT_IFFT/max(abs(DataChunkFFT_IFFT));
DataChunkFFT_IFFT = DataChunkFFT_IFFT;
DataChunkFftMag = abs(DataChunkFFT_IFFT);
subplot(7,5,[31 33]);
plot(DataChunkFftMag);xlim([1, length(DataChunkFftMag)]); ylim([0 1.2]);
set(gca,'xticklabel',[]);set(gca,'yticklabel',[]);
set(gca,'xtick',[]);set(gca,'ytick',[]);
subplot(7,5,34);
plot(real(DataChunkFFT_IFFT),imag(DataChunkFFT_IFFT),'ro','MarkerFaceColor',[1 0 0],'MarkerSize',2);
xlim([-1 1]);ylim([-1 1]);
set(gca,'xticklabel',[]);set(gca,'yticklabel',[]);
set(gca,'xtick',[]);set(gca,'ytick',[]);
subplot(7,5,35);
DataChunkFFT_Comp = DataChunkFFT_IFFT .* PhaseOffset;
plot(real(DataChunkFFT_Comp),imag(DataChunkFFT_Comp),'ro','MarkerFaceColor',[1 0 0],'MarkerSize',2);
xlim([-1 1]);ylim([-1 1]);
set(gca,'xticklabel',[]);set(gca,'yticklabel',[]);
set(gca,'xtick',[]);set(gca,'ytick',[]);